Rhinelander SnackAbility
Overall SnackAbility
Crime in Rhinelander summary. We use data from the FBI to determine the crime rates in Rhinelander. Key points include:
There were 148 total crimes in Rhinelander in the last reporting year.
The overall crime rate per 100,000 people in Rhinelander is 1,815.5 / 100k people.
The violent crime rate per 100,000 people in Rhinelander is 98.1 / 100k people.
The property crime rate per 100,000 people in Rhinelander is 1,717.4 / 100k people.
Overall, crime in Rhinelander is -14.33% below the national average.
Total Crimes
Below National Average
Crime In Rhinelander Comparison Table
| Statistic | Count Raw |
Rhinelander / 100k People |
Wisconsin / 100k People |
National / 100k People |
|---|---|---|---|---|
| Total Crimes Per 100K | 148 | 1,815.5 | 1,432.6 | 2,119.2 |
| Violent Crime | 8 | 98.1 | 278.5 | 359.0 |
| Murder | 0 | 0.0 | 4.2 | 5.0 |
| Robbery | 0 | 0.0 | 39.4 | 61.0 |
| Aggravated Assault | 5 | 61.3 | 200.1 | 256.0 |
| Property Crime | 140 | 1,717.4 | 1,154.1 | 1,760.0 |
| Burglary | 6 | 73.6 | 117.2 | 229.0 |
| Larceny | 129 | 1,582.4 | 875.6 | 1,272.0 |
| Car Theft | 5 | 61.3 | 161.3 | 259.0 |
Source: FBI Uniform Crime Reporting (2024)
Cost of living in Rhinelander summary. We use data on the cost of living to determine how expensive it is to live in Rhinelander. Real estate prices drive most of the variance in cost of living around Wisconsin. Key points include:
The cost of living in Rhinelander is 88 with 100 being average.
The cost of living in Rhinelander is 0.9x lower than the national average.
The median home value in Rhinelander is $254,837.
The median income in Rhinelander is $51,421.
Rhinelander's Overall Cost Of Living
Lower Than The National Average
Cost Of Living In Rhinelander Comparison Table
| Living Expense | Rhinelander | Wisconsin | National Average |
|---|---|---|---|
| Overall | 88 | 98 | 100 |
| Services | 98 | 98 | 100 |
| Groceries | 97 | 100 | 100 |
| Health | 59 | 91 | 100 |
| Housing | 100 | 99 | 100 |
| Transportation | 100 | 102 | 100 |
| Utilities | 98 | 100 | 100 |
Source: Cost of living index, normalized to US average = 100
Rhinelander, WI Weather
The average high in Rhinelander is 51.4° and the average low is 29.8°.
There are 71.1 days of precipitation each year.
Expect an average of 31.4 inches of precipitation each year with 59.9 inches of snow.
| Stat | Rhinelander |
|---|---|
| Average Annual High | 51.4 |
| Average Annual Low | 29.8 |
| Annual Precipitation Days | 71.1 |
| Average Annual Precipitation | 31.4 |
| Average Annual Snowfall | 59.9 |
Average High
Days of Rain
Source: NOAA climate normals (30-year)
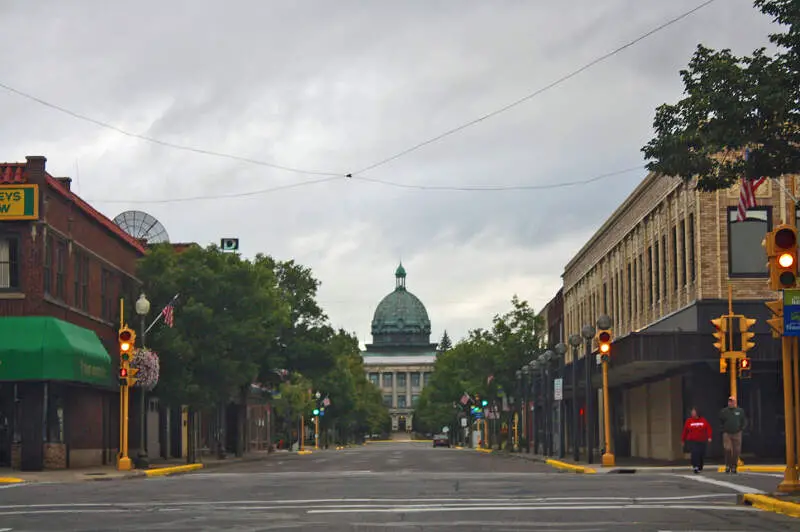
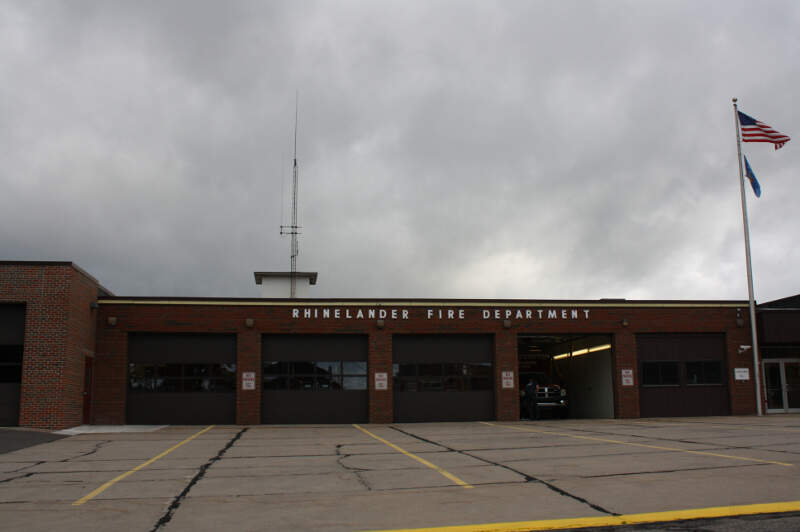
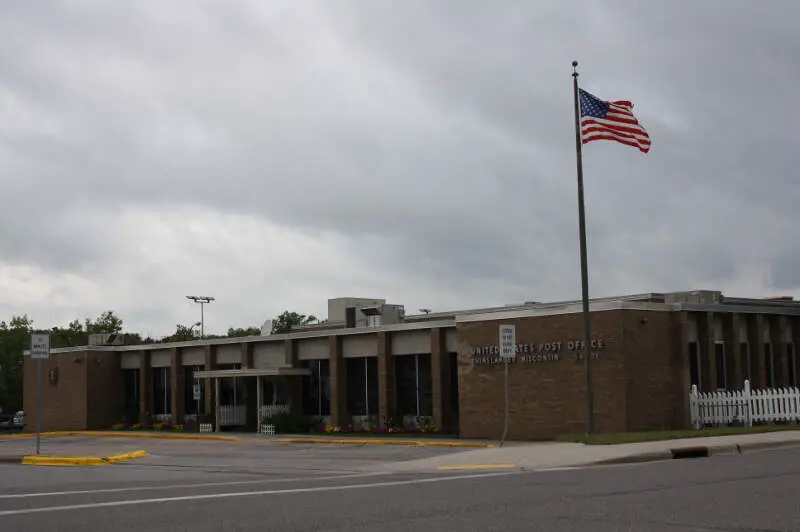
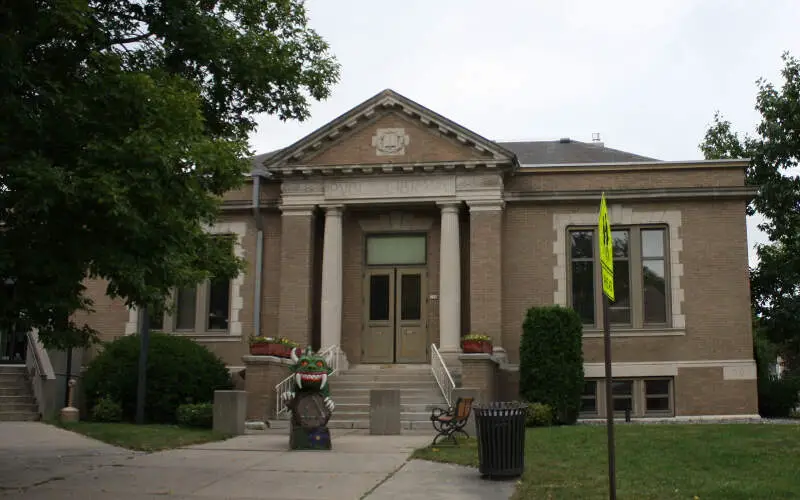
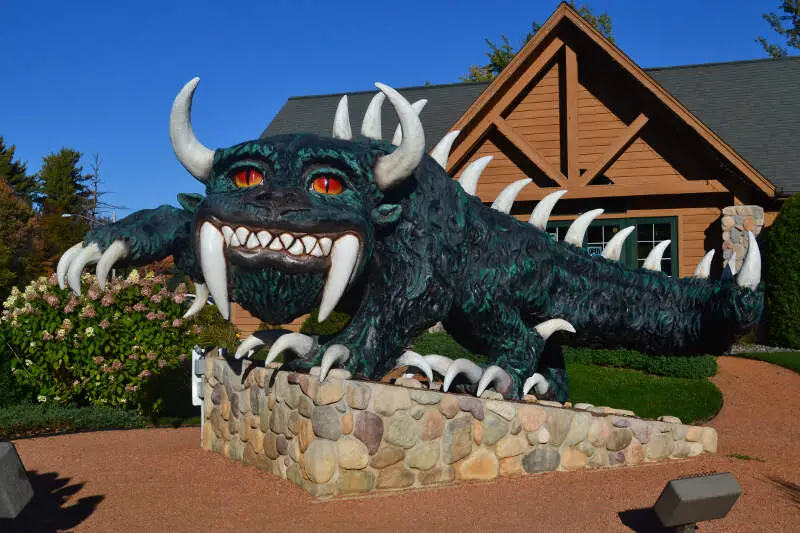
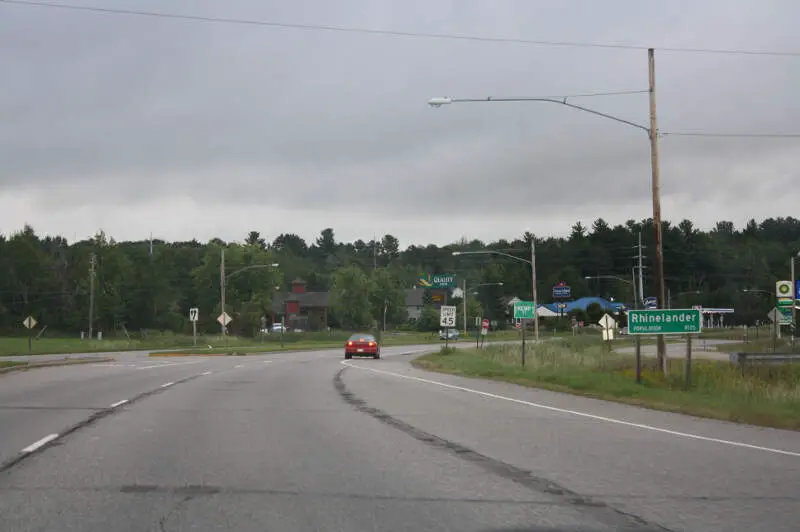
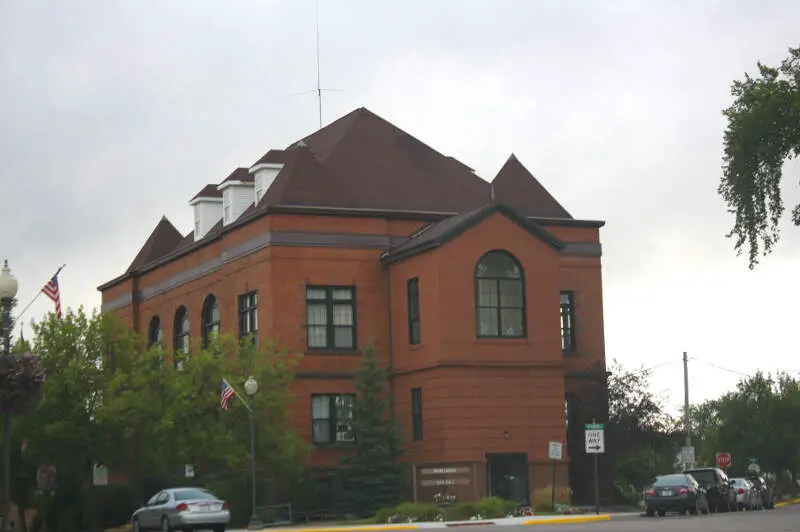
Rhinelander, WI Photos

2 Reviews & Comments About Rhinelander

I've lived in Rhinelander all my life and loved every second of it. If you want to rank cities based on crime and unemployment then have it, but those aren't the deciding factors for whether it's a terrible place to live. If you don't believe me, ask the journal sentinel what they think of Rhinelander: http:m.jsonline.comwisconsin-travel/268294472.htm-
I live in Rhinelander but not in the city limits, I live in a township. From my understanding there are approx. 24,thousand something in the Rhinelander area. About nothing to do!!!!!
Rankings & Articles For Rhinelander


Locations Around Rhinelander
Map Of Rhinelander, WI
Best Places Around Rhinelander
Wausau, WI
Population 39,996
Antigo, WI
Population 8,069
Merrill, WI
Population 9,356
Rhinelander Demographics And Statistics
Population over time in Rhinelander
The current population in Rhinelander is 8,316. The population has increased 5.3% from 2010.
| Year | Population | % Change |
|---|---|---|
| 2024 | 8,316 | 0.8% |
| 2023 | 8,248 | 0.1% |
| 2022 | 8,236 | 0.7% |
| 2021 | 8,177 | 7.4% |
| 2020 | 7,617 | 0.6% |
| 2019 | 7,570 | 0.6% |
| 2018 | 7,528 | 0.4% |
| 2017 | 7,501 | -0.7% |
| 2016 | 7,552 | -0.4% |
| 2015 | 7,583 | -0.8% |
| 2014 | 7,642 | -0.9% |
| 2013 | 7,710 | -0.8% |
| 2012 | 7,776 | -1.0% |
| 2011 | 7,855 | -0.5% |
| 2010 | 7,894 | - |
Race / Ethnicity in Rhinelander
See the full breakdown
Rhinelander is:
92.7% White with 7,710 White residents.
1.1% African American with 91 African American residents.
0.6% American Indian with 52 American Indian residents.
0.0% Asian with 0 Asian residents.
0.0% Hawaiian with 0 Hawaiian residents.
0.0% Other with 0 Other residents.
3.7% Two Or More with 306 Two Or More residents.
1.9% Hispanic with 157 Hispanic residents.
| Race | Rhinelander | WI | USA |
|---|---|---|---|
| White | 92.7% | 78.6% | 57.4% |
| African American | 1.1% | 5.9% | 11.9% |
| American Indian | 0.6% | 0.5% | 0.5% |
| Asian | 0.0% | 2.9% | 5.9% |
| Hawaiian | 0.0% | 0.0% | 0.2% |
| Other | 0.0% | 0.3% | 0.6% |
| Two Or More | 3.7% | 3.7% | 4.3% |
| Hispanic | 1.9% | 8.0% | 19.3% |
Gender in Rhinelander
See the full breakdown
Rhinelander is 50.9% female with 4,236 female residents.
Rhinelander is 49.1% male with 4,080 male residents.
| Gender | Rhinelander | WI | USA |
|---|---|---|---|
| Female | 50.9% | 49.9% | 50.5% |
| Male | 49.1% | 50.1% | 49.5% |
Highest level of educational attainment in Rhinelander for adults over 25
See the full breakdown
2.0% of adults in Rhinelander completed < 9th grade.
3.0% of adults in Rhinelander completed 9-12th grade.
28.0% of adults in Rhinelander completed high school / ged.
29.0% of adults in Rhinelander completed some college.
15.0% of adults in Rhinelander completed associate's degree.
13.0% of adults in Rhinelander completed bachelor's degree.
8.0% of adults in Rhinelander completed master's degree.
1.0% of adults in Rhinelander completed professional degree.
1.0% of adults in Rhinelander completed doctorate degree.
| Education | Rhinelander | WI | USA |
|---|---|---|---|
| < 9th Grade | 2.0% | 4.0% | 4.0% |
| 9-12th Grade | 3.0% | 4.0% | 6.0% |
| High School / GED | 28.0% | 29.0% | 26.0% |
| Some College | 29.0% | 19.0% | 19.0% |
| Associate's Degree | 15.0% | 11.0% | 9.0% |
| Bachelor's Degree | 13.0% | 22.0% | 22.0% |
| Master's Degree | 8.0% | 8.0% | 10.0% |
| Professional Degree | 1.0% | 2.0% | 2.0% |
| Doctorate Degree | 1.0% | 1.0% | 2.0% |
Household Income For Rhinelander, Wisconsin
See the full breakdown
9.6% of households in Rhinelander earn Less than $10,000.
3.6% of households in Rhinelander earn $10,000 to $14,999.
8.1% of households in Rhinelander earn $15,000 to $24,999.
16.9% of households in Rhinelander earn $25,000 to $34,999.
10.6% of households in Rhinelander earn $35,000 to $49,999.
20.3% of households in Rhinelander earn $50,000 to $74,999.
11.6% of households in Rhinelander earn $75,000 to $99,999.
11.0% of households in Rhinelander earn $100,000 to $149,999.
6.9% of households in Rhinelander earn $150,000 to $199,999.
1.3% of households in Rhinelander earn $200,000 or more.
| Income | Rhinelander | WI | USA |
|---|---|---|---|
| Less than $10,000 | 9.6% | 4.1% | 5.0% |
| $10,000 to $14,999 | 3.6% | 3.0% | 3.4% |
| $15,000 to $24,999 | 8.1% | 5.9% | 6.3% |
| $25,000 to $34,999 | 16.9% | 7.2% | 6.6% |
| $35,000 to $49,999 | 10.6% | 10.8% | 10.1% |
| $50,000 to $74,999 | 20.3% | 17.5% | 15.5% |
| $75,000 to $99,999 | 11.6% | 13.8% | 12.6% |
| $100,000 to $149,999 | 11.0% | 19.1% | 17.5% |
| $150,000 to $199,999 | 6.9% | 9.4% | 9.6% |
| $200,000 or more | 1.3% | 9.2% | 13.4% |
Source: U.S. Census ACS 5-year estimates (2024)


