Wheeling SnackAbility
Overall SnackAbility
Crime in Wheeling summary. We use data from the FBI to determine the crime rates in Wheeling. Key points include:
There were 772 total crimes in Wheeling in the last reporting year.
The overall crime rate per 100,000 people in Wheeling is 2,974.8 / 100k people.
The violent crime rate per 100,000 people in Wheeling is 982.6 / 100k people.
The property crime rate per 100,000 people in Wheeling is 1,992.2 / 100k people.
Overall, crime in Wheeling is 40.37% above the national average.
Total Crimes
Above National Average
Crime In Wheeling Comparison Table
| Statistic | Count Raw |
Wheeling / 100k People |
West Virginia / 100k People |
National / 100k People |
|---|---|---|---|---|
| Total Crimes Per 100K | 772 | 2,974.8 | 1,410.8 | 2,119.2 |
| Violent Crime | 255 | 982.6 | 248.8 | 359.0 |
| Murder | 0 | 0.0 | 5.3 | 5.0 |
| Robbery | 14 | 53.9 | 9.7 | 61.0 |
| Aggravated Assault | 227 | 874.7 | 185.8 | 256.0 |
| Property Crime | 517 | 1,992.2 | 1,161.9 | 1,760.0 |
| Burglary | 145 | 558.7 | 178.3 | 229.0 |
| Larceny | 343 | 1,321.7 | 905.1 | 1,272.0 |
| Car Theft | 29 | 111.7 | 78.5 | 259.0 |
Source: FBI Uniform Crime Reporting (2024)
Cost of living in Wheeling summary. We use data on the cost of living to determine how expensive it is to live in Wheeling. Real estate prices drive most of the variance in cost of living around West Virginia. Key points include:
The cost of living in Wheeling is 87 with 100 being average.
The cost of living in Wheeling is 0.9x lower than the national average.
The median home value in Wheeling is $148,166.
The median income in Wheeling is $48,590.
Wheeling's Overall Cost Of Living
Lower Than The National Average
Cost Of Living In Wheeling Comparison Table
| Living Expense | Wheeling | West Virginia | National Average |
|---|---|---|---|
| Overall | 87 | 86 | 100 |
| Services | 99 | 95 | 100 |
| Groceries | 100 | 95 | 100 |
| Health | 62 | 61 | 100 |
| Housing | 99 | 95 | 100 |
| Transportation | 97 | 93 | 100 |
| Utilities | 98 | 93 | 100 |
Source: Cost of living index, normalized to US average = 100
Wheeling, WV Weather
The average high in Wheeling is 62.0° and the average low is 42.2°.
There are 84.3 days of precipitation each year.
Expect an average of 39.9 inches of precipitation each year with 18.4 inches of snow.
| Stat | Wheeling |
|---|---|
| Average Annual High | 62.0 |
| Average Annual Low | 42.2 |
| Annual Precipitation Days | 84.3 |
| Average Annual Precipitation | 39.9 |
| Average Annual Snowfall | 18.4 |
Average High
Days of Rain
Source: NOAA climate normals (30-year)
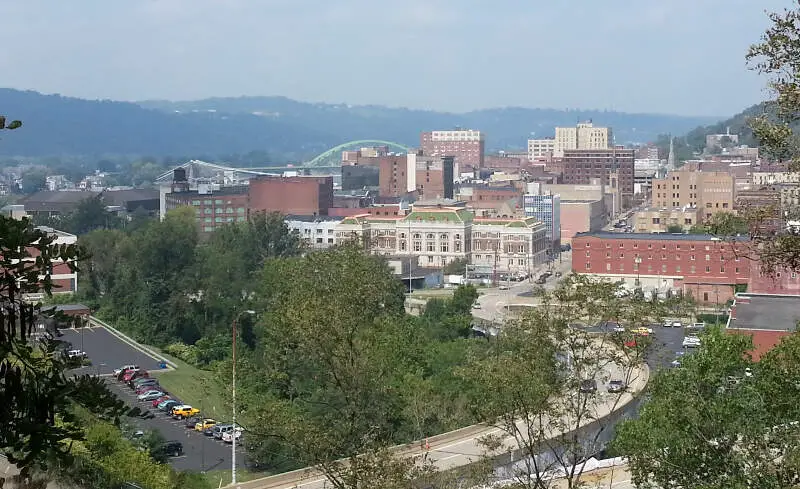
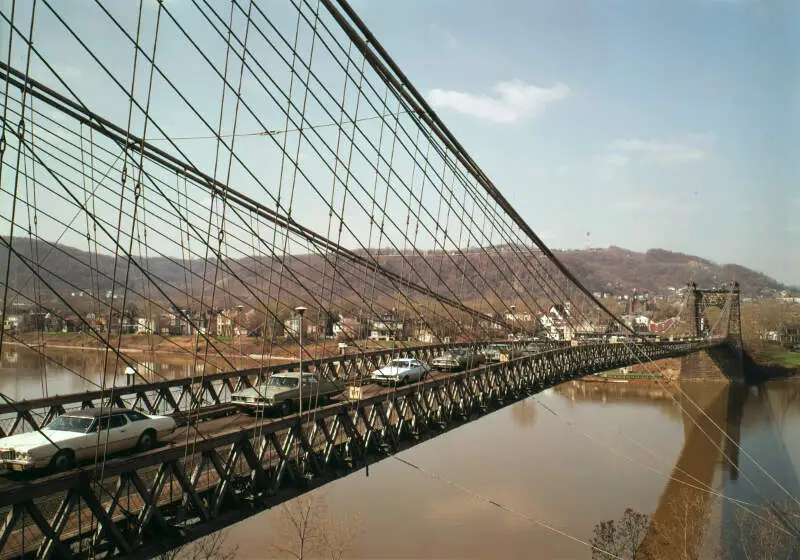
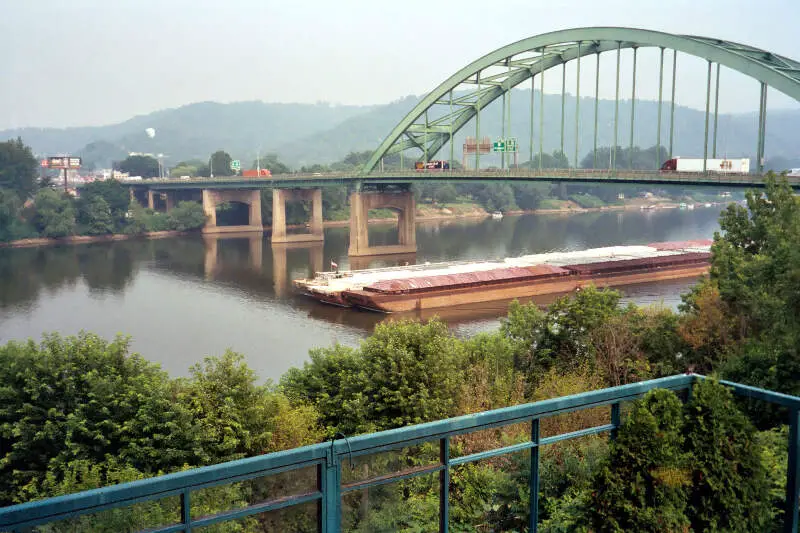
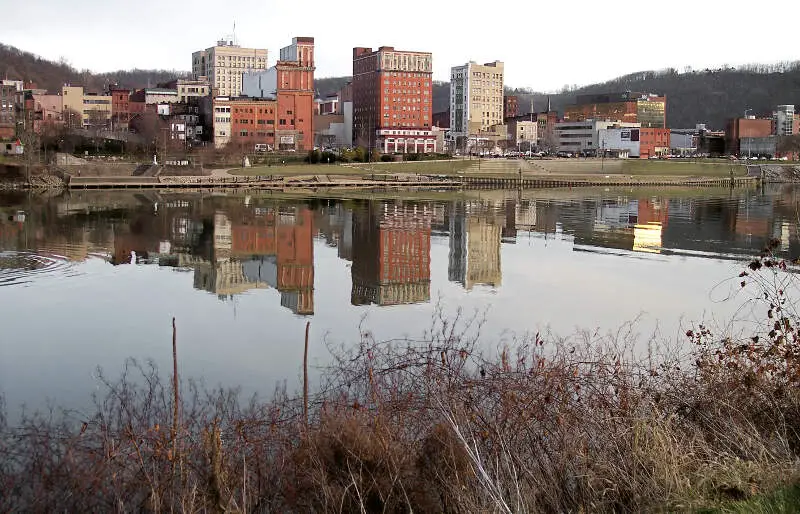
Wheeling, WV Photos

1 Reviews & Comments About Wheeling

Wheeling is a relatively safe, small town located in a tri-state area of the Ohio Valley within 60 minutes of Pittsburgh, PA with the nearest international airport.
The waterfront of downtown can also be lively in the summer with various music events. The Center Market area is a cute, trendy spot with a local brewery, a wine bar, a hair salon, a coffee shop, a creperie and some antiques shops. Don't miss Ogelbay Park, a wonderful resort with upscale dining, golf, tennis, and more and the Festival of Lights at Christmas.
Rankings & Articles For Wheeling


Locations Around Wheeling
Map Of Wheeling, WV
Best Places Around Wheeling
New Philadelphia, OH
Population 17,520
St. Clairsville, OH
Population 5,003
Glenshaw, PA
Population 9,139
Franklin Park, PA
Population 15,235
Pleasant Hills, PA
Population 8,399
Dormont, PA
Population 8,063
Castle Shannon, PA
Population 8,209
Whitehall, PA
Population 14,811
West View, PA
Population 6,533
Wheeling Demographics And Statistics
Population over time in Wheeling
The current population in Wheeling is 26,350. The population has decreased 8.7% from 2010.
| Year | Population | % Change |
|---|---|---|
| 2024 | 26,350 | -1.2% |
| 2023 | 26,670 | -0.9% |
| 2022 | 26,900 | -0.9% |
| 2021 | 27,142 | 0.4% |
| 2020 | 27,046 | -0.1% |
| 2019 | 27,062 | -0.5% |
| 2018 | 27,190 | -1.2% |
| 2017 | 27,521 | -0.9% |
| 2016 | 27,758 | -0.5% |
| 2015 | 27,894 | -0.8% |
| 2014 | 28,129 | -1.1% |
| 2013 | 28,439 | -0.8% |
| 2012 | 28,662 | -0.3% |
| 2011 | 28,745 | -0.4% |
| 2010 | 28,861 | - |
Race / Ethnicity in Wheeling
See the full breakdown
Wheeling is:
88.8% White with 23,402 White residents.
4.5% African American with 1,180 African American residents.
0.1% American Indian with 27 American Indian residents.
0.4% Asian with 95 Asian residents.
0.0% Hawaiian with 0 Hawaiian residents.
0.1% Other with 31 Other residents.
4.7% Two Or More with 1,247 Two Or More residents.
1.4% Hispanic with 368 Hispanic residents.
| Race | Wheeling | WV | USA |
|---|---|---|---|
| White | 88.8% | 89.7% | 57.4% |
| African American | 4.5% | 3.1% | 11.9% |
| American Indian | 0.1% | 0.1% | 0.5% |
| Asian | 0.4% | 0.8% | 5.9% |
| Hawaiian | 0.0% | 0.0% | 0.2% |
| Other | 0.1% | 0.3% | 0.6% |
| Two Or More | 4.7% | 3.9% | 4.3% |
| Hispanic | 1.4% | 2.1% | 19.3% |
Gender in Wheeling
See the full breakdown
Wheeling is 52.8% female with 13,914 female residents.
Wheeling is 47.2% male with 12,436 male residents.
| Gender | Wheeling | WV | USA |
|---|---|---|---|
| Female | 52.8% | 50.1% | 50.5% |
| Male | 47.2% | 49.9% | 49.5% |
Highest level of educational attainment in Wheeling for adults over 25
See the full breakdown
2.0% of adults in Wheeling completed < 9th grade.
6.0% of adults in Wheeling completed 9-12th grade.
32.0% of adults in Wheeling completed high school / ged.
18.0% of adults in Wheeling completed some college.
8.0% of adults in Wheeling completed associate's degree.
20.0% of adults in Wheeling completed bachelor's degree.
10.0% of adults in Wheeling completed master's degree.
2.0% of adults in Wheeling completed professional degree.
2.0% of adults in Wheeling completed doctorate degree.
| Education | Wheeling | WV | USA |
|---|---|---|---|
| < 9th Grade | 2.0% | 5.0% | 4.0% |
| 9-12th Grade | 6.0% | 7.0% | 6.0% |
| High School / GED | 32.0% | 39.0% | 26.0% |
| Some College | 18.0% | 17.0% | 19.0% |
| Associate's Degree | 8.0% | 8.0% | 9.0% |
| Bachelor's Degree | 20.0% | 14.0% | 22.0% |
| Master's Degree | 10.0% | 7.0% | 10.0% |
| Professional Degree | 2.0% | 2.0% | 2.0% |
| Doctorate Degree | 2.0% | 1.0% | 2.0% |
Household Income For Wheeling, West Virginia
See the full breakdown
7.8% of households in Wheeling earn Less than $10,000.
9.3% of households in Wheeling earn $10,000 to $14,999.
10.3% of households in Wheeling earn $15,000 to $24,999.
11.2% of households in Wheeling earn $25,000 to $34,999.
12.9% of households in Wheeling earn $35,000 to $49,999.
13.5% of households in Wheeling earn $50,000 to $74,999.
11.2% of households in Wheeling earn $75,000 to $99,999.
11.2% of households in Wheeling earn $100,000 to $149,999.
6.7% of households in Wheeling earn $150,000 to $199,999.
5.9% of households in Wheeling earn $200,000 or more.
| Income | Wheeling | WV | USA |
|---|---|---|---|
| Less than $10,000 | 7.8% | 6.2% | 5.0% |
| $10,000 to $14,999 | 9.3% | 5.5% | 3.4% |
| $15,000 to $24,999 | 10.3% | 9.4% | 6.3% |
| $25,000 to $34,999 | 11.2% | 9.2% | 6.6% |
| $35,000 to $49,999 | 12.9% | 12.4% | 10.1% |
| $50,000 to $74,999 | 13.5% | 17.3% | 15.5% |
| $75,000 to $99,999 | 11.2% | 12.7% | 12.6% |
| $100,000 to $149,999 | 11.2% | 15.1% | 17.5% |
| $150,000 to $199,999 | 6.7% | 6.3% | 9.6% |
| $200,000 or more | 5.9% | 5.9% | 13.4% |
Source: U.S. Census ACS 5-year estimates (2024)


