Alabaster SnackAbility
Overall SnackAbility
Crime in Alabaster summary. We use data from the FBI to determine the crime rates in Alabaster. Key points include:
There were 553 total crimes in Alabaster in the last reporting year.
The overall crime rate per 100,000 people in Alabaster is 1,609.9 / 100k people.
The violent crime rate per 100,000 people in Alabaster is 99.0 / 100k people.
The property crime rate per 100,000 people in Alabaster is 1,511.0 / 100k people.
Overall, crime in Alabaster is -24.03% below the national average.
Total Crimes
Below National Average
Crime In Alabaster Comparison Table
| Statistic | Count Raw |
Alabaster / 100k People |
Alabama / 100k People |
National / 100k People |
|---|---|---|---|---|
| Total Crimes Per 100K | 553 | 1,609.9 | 1,924.9 | 2,119.2 |
| Violent Crime | 34 | 99.0 | 359.9 | 359.0 |
| Murder | 0 | 0.0 | 8.7 | 5.0 |
| Robbery | 4 | 11.6 | 34.0 | 61.0 |
| Aggravated Assault | 29 | 84.4 | 291.4 | 256.0 |
| Property Crime | 519 | 1,511.0 | 1,565.1 | 1,760.0 |
| Burglary | 17 | 49.5 | 243.5 | 229.0 |
| Larceny | 480 | 1,397.4 | 1,148.5 | 1,272.0 |
| Car Theft | 22 | 64.0 | 173.0 | 259.0 |
Source: FBI Uniform Crime Reporting (2024)
Cost of living in Alabaster summary. We use data on the cost of living to determine how expensive it is to live in Alabaster. Real estate prices drive most of the variance in cost of living around Alabama. Key points include:
The cost of living in Alabaster is 100 with 100 being average.
The cost of living in Alabaster is 1.0x lower than the national average.
The median home value in Alabaster is $303,749.
The median income in Alabaster is $91,357.
Alabaster's Overall Cost Of Living
Lower Than The National Average
Cost Of Living In Alabaster Comparison Table
| Living Expense | Alabaster | Alabama | National Average |
|---|---|---|---|
| Overall | 100 | 91 | 100 |
| Services | 96 | 95 | 100 |
| Groceries | 96 | 96 | 100 |
| Health | 104 | 74 | 100 |
| Housing | 99 | 96 | 100 |
| Transportation | 98 | 95 | 100 |
| Utilities | 94 | 95 | 100 |
Source: Cost of living index, normalized to US average = 100
Alabaster, AL Weather
The average high in Alabaster is 74.5° and the average low is 51.0°.
There are 78.4 days of precipitation each year.
Expect an average of 55.1 inches of precipitation each year with 0.7 inches of snow.
| Stat | Alabaster |
|---|---|
| Average Annual High | 74.5 |
| Average Annual Low | 51.0 |
| Annual Precipitation Days | 78.4 |
| Average Annual Precipitation | 55.1 |
| Average Annual Snowfall | 0.7 |
Average High
Days of Rain
Source: NOAA climate normals (30-year)
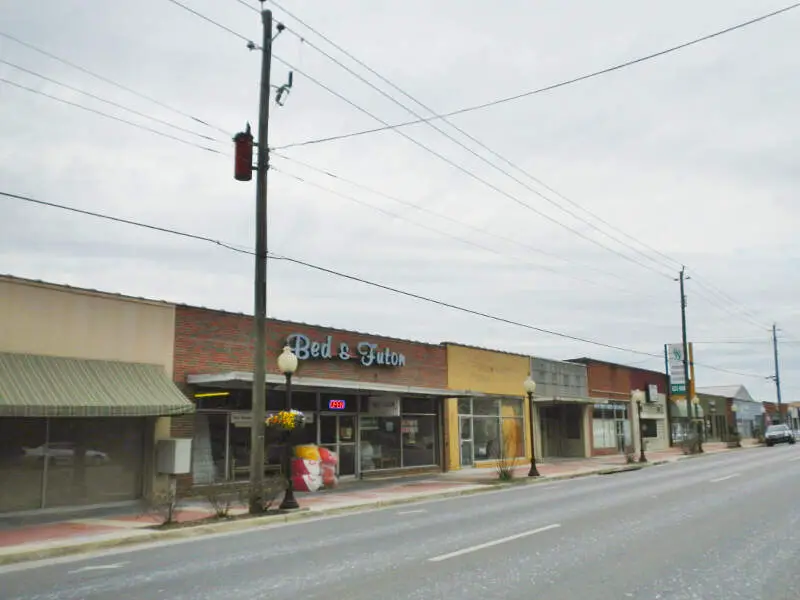
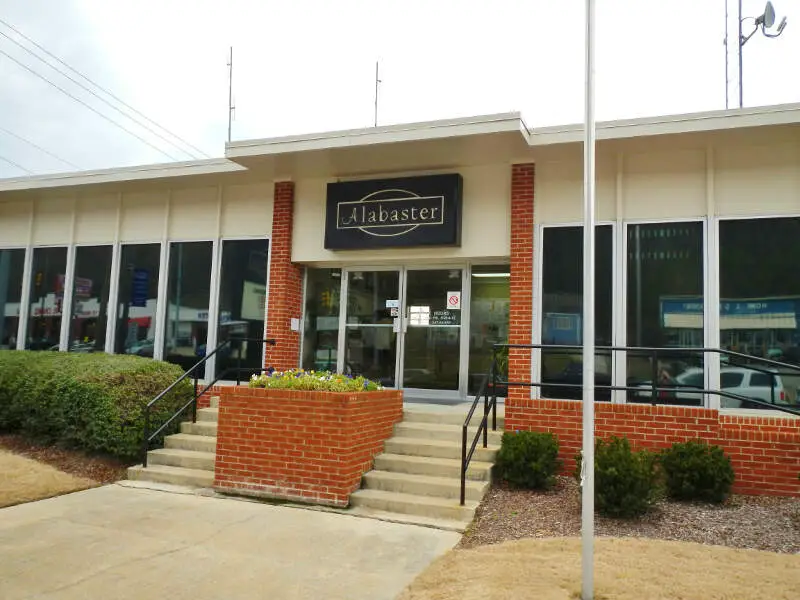
Alabaster, AL Photos
1 Reviews & Comments About Alabaster

I lived there 4 years. I loved the people there most are just down home people and who you see is who you see everytime. Meaning they are not fake about anything. i love it all the way from Smokey Hollow cafe down to our Walmart supercenter. but let people keep seeing this so we can keep our towns just like it is. and we can keep our small town simple life with it!!!
Rankings & Articles For Alabaster


Locations Around Alabaster
Map Of Alabaster, AL
Best Places Around Alabaster
Bessemer, AL
Population 25,400
Fairfield, AL
Population 9,728
Calera, AL
Population 17,714
Hueytown, AL
Population 16,414
Chelsea, AL
Population 16,260
Pelham, AL
Population 24,827
Homewood, AL
Population 27,829
Helena, AL
Population 21,769
Hoover, AL
Population 92,642
Mountain Brook, AL
Population 22,029
Alabaster Demographics And Statistics
Population over time in Alabaster
The current population in Alabaster is 33,917. The population has increased 14.8% from 2010.
| Year | Population | % Change |
|---|---|---|
| 2024 | 33,917 | 0.8% |
| 2023 | 33,633 | 0.6% |
| 2022 | 33,417 | 0.9% |
| 2021 | 33,133 | -0.7% |
| 2020 | 33,373 | 0.6% |
| 2019 | 33,176 | 0.9% |
| 2018 | 32,878 | 1.0% |
| 2017 | 32,567 | 0.9% |
| 2016 | 32,269 | 1.1% |
| 2015 | 31,905 | 3.0% |
| 2014 | 30,978 | 0.8% |
| 2013 | 30,719 | 1.1% |
| 2012 | 30,372 | 1.2% |
| 2011 | 30,013 | 1.6% |
| 2010 | 29,550 | - |
Race / Ethnicity in Alabaster
See the full breakdown
Alabaster is:
67.1% White with 22,765 White residents.
16.1% African American with 5,459 African American residents.
0.3% American Indian with 92 American Indian residents.
1.1% Asian with 376 Asian residents.
0.0% Hawaiian with 0 Hawaiian residents.
0.4% Other with 145 Other residents.
2.6% Two Or More with 890 Two Or More residents.
12.4% Hispanic with 4,190 Hispanic residents.
| Race | Alabaster | AL | USA |
|---|---|---|---|
| White | 67.1% | 63.4% | 57.4% |
| African American | 16.1% | 25.6% | 11.9% |
| American Indian | 0.3% | 0.3% | 0.5% |
| Asian | 1.1% | 1.4% | 5.9% |
| Hawaiian | 0.0% | 0.0% | 0.2% |
| Other | 0.4% | 0.4% | 0.6% |
| Two Or More | 2.6% | 3.3% | 4.3% |
| Hispanic | 12.4% | 5.6% | 19.3% |
Gender in Alabaster
See the full breakdown
Alabaster is 51.4% female with 17,424 female residents.
Alabaster is 48.6% male with 16,493 male residents.
| Gender | Alabaster | AL | USA |
|---|---|---|---|
| Female | 51.4% | 51.4% | 50.5% |
| Male | 48.6% | 48.6% | 49.5% |
Highest level of educational attainment in Alabaster for adults over 25
See the full breakdown
4.0% of adults in Alabaster completed < 9th grade.
4.0% of adults in Alabaster completed 9-12th grade.
25.0% of adults in Alabaster completed high school / ged.
18.0% of adults in Alabaster completed some college.
9.0% of adults in Alabaster completed associate's degree.
28.0% of adults in Alabaster completed bachelor's degree.
10.0% of adults in Alabaster completed master's degree.
1.0% of adults in Alabaster completed professional degree.
1.0% of adults in Alabaster completed doctorate degree.
| Education | Alabaster | AL | USA |
|---|---|---|---|
| < 9th Grade | 4.0% | 4.0% | 4.0% |
| 9-12th Grade | 4.0% | 8.0% | 6.0% |
| High School / GED | 25.0% | 30.0% | 26.0% |
| Some College | 18.0% | 21.0% | 19.0% |
| Associate's Degree | 9.0% | 9.0% | 9.0% |
| Bachelor's Degree | 28.0% | 17.0% | 22.0% |
| Master's Degree | 10.0% | 8.0% | 10.0% |
| Professional Degree | 1.0% | 2.0% | 2.0% |
| Doctorate Degree | 1.0% | 1.0% | 2.0% |
Household Income For Alabaster, Alabama
See the full breakdown
4.2% of households in Alabaster earn Less than $10,000.
2.4% of households in Alabaster earn $10,000 to $14,999.
3.4% of households in Alabaster earn $15,000 to $24,999.
3.3% of households in Alabaster earn $25,000 to $34,999.
9.2% of households in Alabaster earn $35,000 to $49,999.
16.3% of households in Alabaster earn $50,000 to $74,999.
16.6% of households in Alabaster earn $75,000 to $99,999.
20.9% of households in Alabaster earn $100,000 to $149,999.
11.8% of households in Alabaster earn $150,000 to $199,999.
11.9% of households in Alabaster earn $200,000 or more.
| Income | Alabaster | AL | USA |
|---|---|---|---|
| Less than $10,000 | 4.2% | 6.3% | 5.0% |
| $10,000 to $14,999 | 2.4% | 4.7% | 3.4% |
| $15,000 to $24,999 | 3.4% | 8.8% | 6.3% |
| $25,000 to $34,999 | 3.3% | 8.5% | 6.6% |
| $35,000 to $49,999 | 9.2% | 11.8% | 10.1% |
| $50,000 to $74,999 | 16.3% | 16.7% | 15.5% |
| $75,000 to $99,999 | 16.6% | 12.7% | 12.6% |
| $100,000 to $149,999 | 20.9% | 15.5% | 17.5% |
| $150,000 to $199,999 | 11.8% | 7.4% | 9.6% |
| $200,000 or more | 11.9% | 7.8% | 13.4% |
Source: U.S. Census ACS 5-year estimates (2024)


