Chelsea SnackAbility
Overall SnackAbility
Cost of living in Chelsea summary. We use data on the cost of living to determine how expensive it is to live in Chelsea. Real estate prices drive most of the variance in cost of living around Alabama. Key points include:
The cost of living in Chelsea is 107 with 100 being average.
The cost of living in Chelsea is 1.1x higher than the national average.
The median home value in Chelsea is $384,777.
The median income in Chelsea is $115,337.
Chelsea's Overall Cost Of Living
Higher Than The National Average
Cost Of Living In Chelsea Comparison Table
| Living Expense | Chelsea | Alabama | National Average |
|---|---|---|---|
| Overall | 107 | 91 | 100 |
| Services | 96 | 95 | 100 |
| Groceries | 97 | 96 | 100 |
| Health | 135 | 74 | 100 |
| Housing | 94 | 96 | 100 |
| Transportation | 94 | 95 | 100 |
| Utilities | 98 | 95 | 100 |
Source: Cost of living index, normalized to US average = 100
Chelsea, AL Weather
The average high in Chelsea is 74.5° and the average low is 51.0°.
There are 78.4 days of precipitation each year.
Expect an average of 55.1 inches of precipitation each year with 0.7 inches of snow.
| Stat | Chelsea |
|---|---|
| Average Annual High | 74.5 |
| Average Annual Low | 51.0 |
| Annual Precipitation Days | 78.4 |
| Average Annual Precipitation | 55.1 |
| Average Annual Snowfall | 0.7 |
Average High
Days of Rain
Source: NOAA climate normals (30-year)
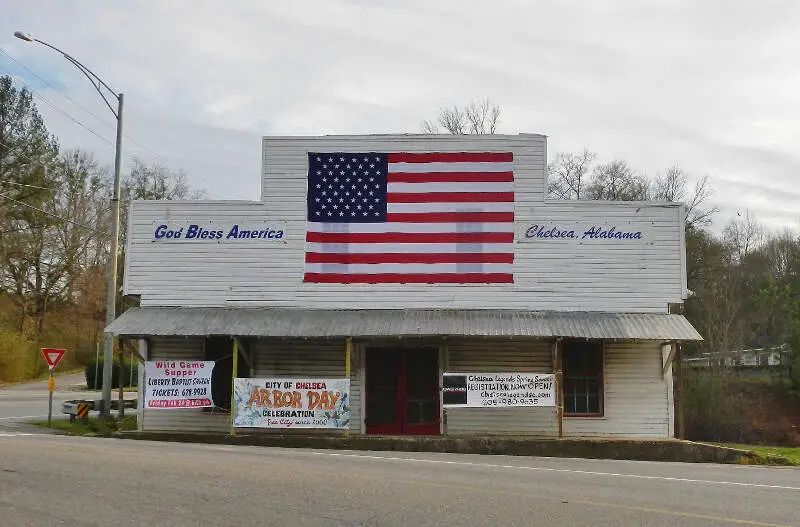
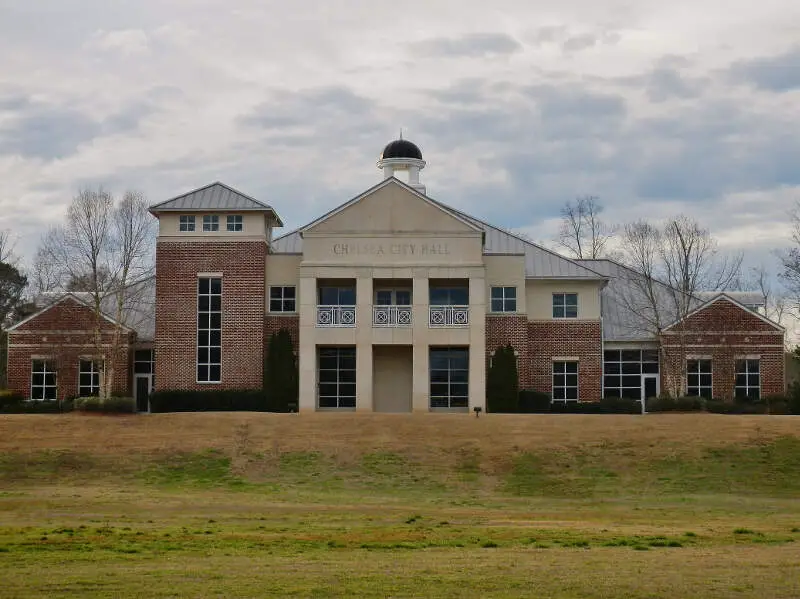
Chelsea, AL Photos
Rankings & Articles For Chelsea


Locations Around Chelsea
Map Of Chelsea, AL
Best Places Around Chelsea
Bessemer, AL
Population 25,400
Birmingham, AL
Population 198,173
Fairfield, AL
Population 9,728
Calera, AL
Population 17,714
Irondale, AL
Population 13,464
Leeds, AL
Population 12,028
Pelham, AL
Population 24,827
Homewood, AL
Population 27,829
Helena, AL
Population 21,769
Alabaster, AL
Population 33,917
Chelsea Demographics And Statistics
Population over time in Chelsea
The current population in Chelsea is 16,260. The population has increased 76.7% from 2010.
| Year | Population | % Change |
|---|---|---|
| 2024 | 16,260 | 3.4% |
| 2023 | 15,731 | 3.5% |
| 2022 | 15,201 | 3.3% |
| 2021 | 14,710 | 8.2% |
| 2020 | 13,599 | 3.8% |
| 2019 | 13,098 | 3.6% |
| 2018 | 12,643 | 3.6% |
| 2017 | 12,199 | 4.2% |
| 2016 | 11,706 | 2.8% |
| 2015 | 11,386 | 3.0% |
| 2014 | 11,051 | 4.1% |
| 2013 | 10,612 | 4.4% |
| 2012 | 10,161 | 5.2% |
| 2011 | 9,660 | 5.0% |
| 2010 | 9,202 | - |
Race / Ethnicity in Chelsea
See the full breakdown
Chelsea is:
80.5% White with 13,086 White residents.
8.5% African American with 1,376 African American residents.
0.0% American Indian with 0 American Indian residents.
0.7% Asian with 108 Asian residents.
0.0% Hawaiian with 0 Hawaiian residents.
0.0% Other with 0 Other residents.
4.4% Two Or More with 722 Two Or More residents.
6.0% Hispanic with 968 Hispanic residents.
| Race | Chelsea | AL | USA |
|---|---|---|---|
| White | 80.5% | 63.4% | 57.4% |
| African American | 8.5% | 25.6% | 11.9% |
| American Indian | 0.0% | 0.3% | 0.5% |
| Asian | 0.7% | 1.4% | 5.9% |
| Hawaiian | 0.0% | 0.0% | 0.2% |
| Other | 0.0% | 0.4% | 0.6% |
| Two Or More | 4.4% | 3.3% | 4.3% |
| Hispanic | 6.0% | 5.6% | 19.3% |
Gender in Chelsea
See the full breakdown
Chelsea is 48.3% female with 7,852 female residents.
Chelsea is 51.7% male with 8,408 male residents.
| Gender | Chelsea | AL | USA |
|---|---|---|---|
| Female | 48.3% | 51.4% | 50.5% |
| Male | 51.7% | 48.6% | 49.5% |
Highest level of educational attainment in Chelsea for adults over 25
See the full breakdown
0.0% of adults in Chelsea completed < 9th grade.
2.0% of adults in Chelsea completed 9-12th grade.
15.0% of adults in Chelsea completed high school / ged.
23.0% of adults in Chelsea completed some college.
11.0% of adults in Chelsea completed associate's degree.
36.0% of adults in Chelsea completed bachelor's degree.
10.0% of adults in Chelsea completed master's degree.
2.0% of adults in Chelsea completed professional degree.
1.0% of adults in Chelsea completed doctorate degree.
| Education | Chelsea | AL | USA |
|---|---|---|---|
| < 9th Grade | 0.0% | 4.0% | 4.0% |
| 9-12th Grade | 2.0% | 8.0% | 6.0% |
| High School / GED | 15.0% | 30.0% | 26.0% |
| Some College | 23.0% | 21.0% | 19.0% |
| Associate's Degree | 11.0% | 9.0% | 9.0% |
| Bachelor's Degree | 36.0% | 17.0% | 22.0% |
| Master's Degree | 10.0% | 8.0% | 10.0% |
| Professional Degree | 2.0% | 2.0% | 2.0% |
| Doctorate Degree | 1.0% | 1.0% | 2.0% |
Household Income For Chelsea, Alabama
See the full breakdown
2.3% of households in Chelsea earn Less than $10,000.
1.1% of households in Chelsea earn $10,000 to $14,999.
2.7% of households in Chelsea earn $15,000 to $24,999.
3.5% of households in Chelsea earn $25,000 to $34,999.
6.9% of households in Chelsea earn $35,000 to $49,999.
9.2% of households in Chelsea earn $50,000 to $74,999.
17.5% of households in Chelsea earn $75,000 to $99,999.
25.2% of households in Chelsea earn $100,000 to $149,999.
14.3% of households in Chelsea earn $150,000 to $199,999.
17.4% of households in Chelsea earn $200,000 or more.
| Income | Chelsea | AL | USA |
|---|---|---|---|
| Less than $10,000 | 2.3% | 6.3% | 5.0% |
| $10,000 to $14,999 | 1.1% | 4.7% | 3.4% |
| $15,000 to $24,999 | 2.7% | 8.8% | 6.3% |
| $25,000 to $34,999 | 3.5% | 8.5% | 6.6% |
| $35,000 to $49,999 | 6.9% | 11.8% | 10.1% |
| $50,000 to $74,999 | 9.2% | 16.7% | 15.5% |
| $75,000 to $99,999 | 17.5% | 12.7% | 12.6% |
| $100,000 to $149,999 | 25.2% | 15.5% | 17.5% |
| $150,000 to $199,999 | 14.3% | 7.4% | 9.6% |
| $200,000 or more | 17.4% | 7.8% | 13.4% |
Source: U.S. Census ACS 5-year estimates (2024)


