Birmingham SnackAbility
Overall SnackAbility
Cost of living in Birmingham summary. We use data on the cost of living to determine how expensive it is to live in Birmingham. Real estate prices drive most of the variance in cost of living around Alabama. Key points include:
The cost of living in Birmingham is 90 with 100 being average.
The cost of living in Birmingham is 0.9x lower than the national average.
The median home value in Birmingham is $135,870.
The median income in Birmingham is $46,051.
Birmingham's Overall Cost Of Living
Lower Than The National Average
Cost Of Living In Birmingham Comparison Table
| Living Expense | Birmingham | Alabama | National Average |
|---|---|---|---|
| Overall | 90 | 91 | 100 |
| Services | 100 | 95 | 100 |
| Groceries | 101 | 96 | 100 |
| Health | 66 | 74 | 100 |
| Housing | 98 | 96 | 100 |
| Transportation | 97 | 95 | 100 |
| Utilities | 96 | 95 | 100 |
Source: Cost of living index, normalized to US average = 100
Birmingham, AL Weather
The average high in Birmingham is 73.6° and the average low is 51.4°.
There are 78.6 days of precipitation each year.
Expect an average of 56.2 inches of precipitation each year with 1.3 inches of snow.
| Stat | Birmingham |
|---|---|
| Average Annual High | 73.6 |
| Average Annual Low | 51.4 |
| Annual Precipitation Days | 78.6 |
| Average Annual Precipitation | 56.2 |
| Average Annual Snowfall | 1.3 |
Average High
Days of Rain
Source: NOAA climate normals (30-year)
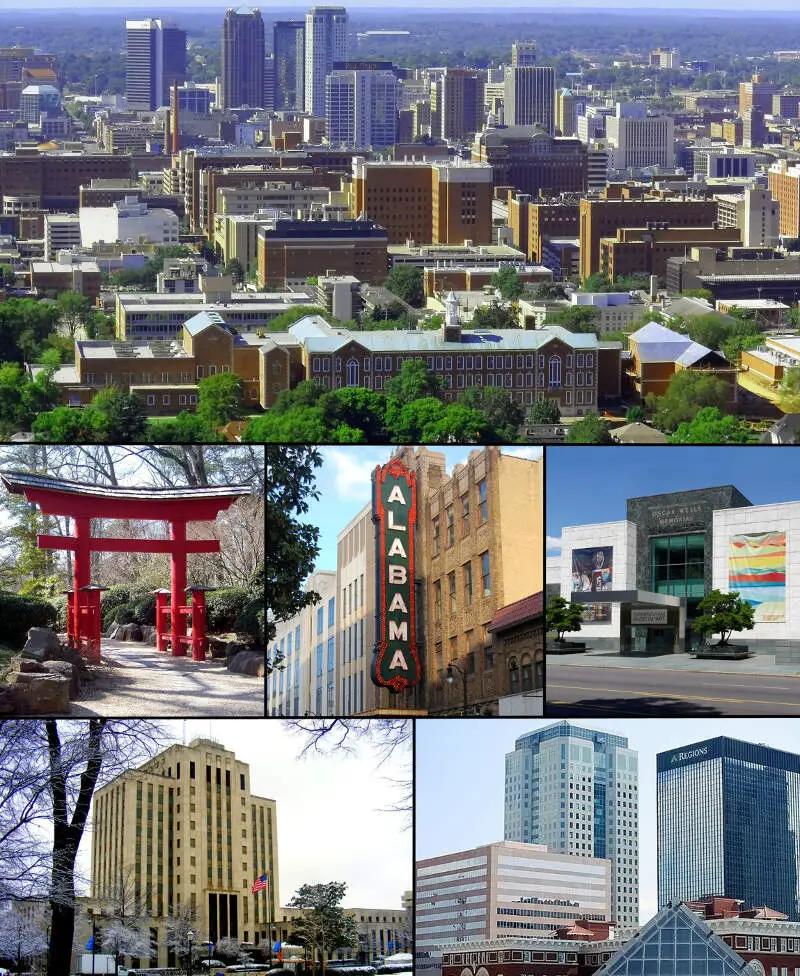
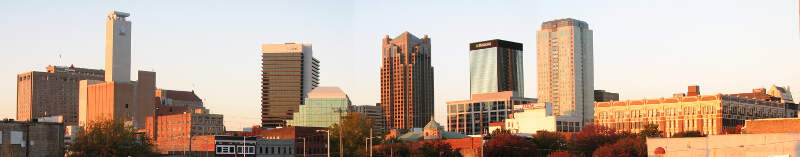
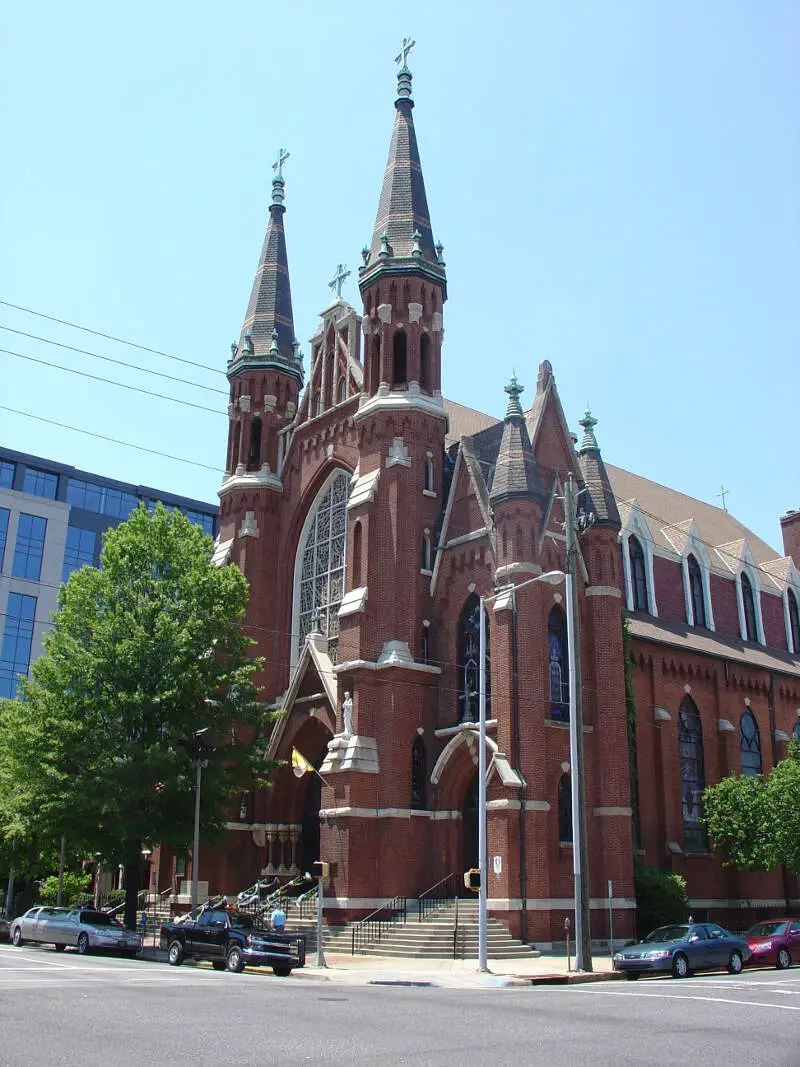
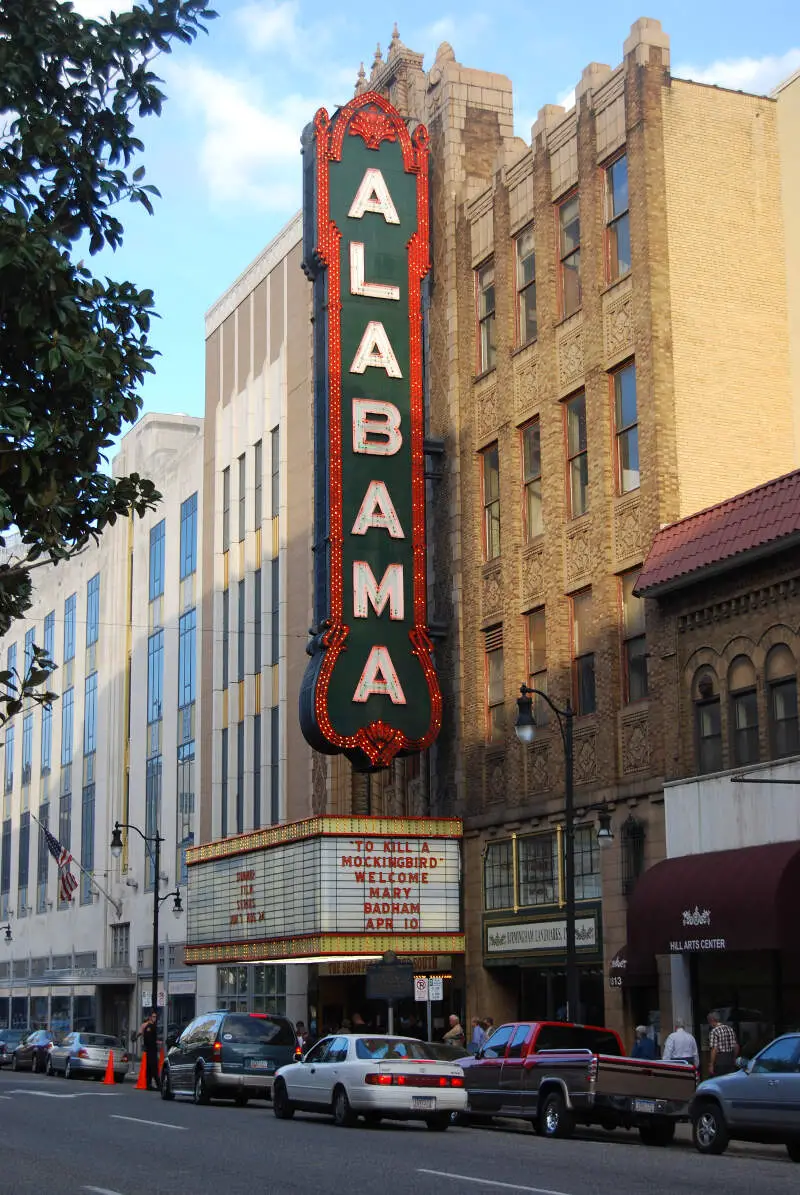
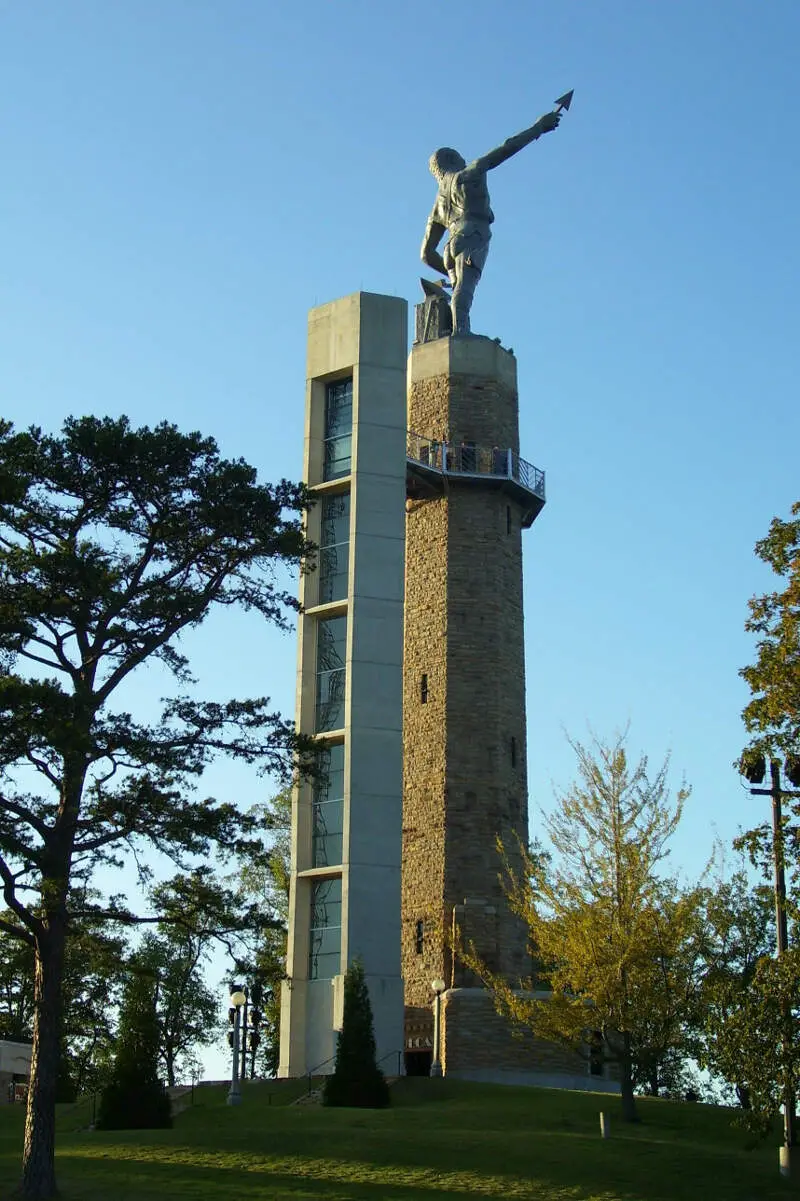
Birmingham, AL Photos


3 Reviews & Comments About Birmingham

I live in Birmingham and I'm moving to a different part now but a WEEK ago my mom pulled up to the gas station and my mom told me don't get out * while locking the doors * because these two sketchy a*s guys were there and I was wearing my fursuit so they are like meow meow I am awkwardly laughing but after one of them look in my window because I rolled it down my window about 2 inches and one said I'll take you to my house and we can have so much fun looking toward my b*****s after that my mom rolled up the windows and we got the h**l out of there did I mention it's was 12:54AM
I live in Birmingham and my house isn't bad at all !,!,!,
This place is very racist and not good at all its like a ghost town.
Its very racist and not a good place to live.
Rankings & Articles For Birmingham


Locations Around Birmingham
Map Of Birmingham, AL
Best Places Around Birmingham
Bessemer, AL
Population 25,400
Fairfield, AL
Population 9,728
Irondale, AL
Population 13,464
Moody, AL
Population 13,488
Leeds, AL
Population 12,028
Center Point, AL
Population 15,914
Hueytown, AL
Population 16,414
Trussville, AL
Population 26,673
Chelsea, AL
Population 16,260
Pelham, AL
Population 24,827
Birmingham Demographics And Statistics
Population over time in Birmingham
The current population in Birmingham is 198,173. The population has decreased 8.4% from 2010.
| Year | Population | % Change |
|---|---|---|
| 2024 | 198,173 | -0.6% |
| 2023 | 199,322 | -0.6% |
| 2022 | 200,431 | -0.9% |
| 2021 | 202,234 | -4.1% |
| 2020 | 210,928 | -0.6% |
| 2019 | 212,297 | 0.1% |
| 2018 | 212,021 | -0.1% |
| 2017 | 212,265 | -0.1% |
| 2016 | 212,424 | 0.1% |
| 2015 | 212,211 | 0.2% |
| 2014 | 211,705 | -0.3% |
| 2013 | 212,295 | -0.4% |
| 2012 | 213,180 | -0.5% |
| 2011 | 214,348 | -0.9% |
| 2010 | 216,392 | - |
Race / Ethnicity in Birmingham
See the full breakdown
Birmingham is:
24.2% White with 48,042 White residents.
66.7% African American with 132,151 African American residents.
0.1% American Indian with 143 American Indian residents.
1.4% Asian with 2,730 Asian residents.
0.1% Hawaiian with 106 Hawaiian residents.
0.6% Other with 1,146 Other residents.
2.2% Two Or More with 4,428 Two Or More residents.
4.8% Hispanic with 9,427 Hispanic residents.
| Race | Birmingham | AL | USA |
|---|---|---|---|
| White | 24.2% | 63.4% | 57.4% |
| African American | 66.7% | 25.6% | 11.9% |
| American Indian | 0.1% | 0.3% | 0.5% |
| Asian | 1.4% | 1.4% | 5.9% |
| Hawaiian | 0.1% | 0.0% | 0.2% |
| Other | 0.6% | 0.4% | 0.6% |
| Two Or More | 2.2% | 3.3% | 4.3% |
| Hispanic | 4.8% | 5.6% | 19.3% |
Gender in Birmingham
See the full breakdown
Birmingham is 53.1% female with 105,314 female residents.
Birmingham is 46.9% male with 92,859 male residents.
| Gender | Birmingham | AL | USA |
|---|---|---|---|
| Female | 53.1% | 51.4% | 50.5% |
| Male | 46.9% | 48.6% | 49.5% |
Highest level of educational attainment in Birmingham for adults over 25
See the full breakdown
4.0% of adults in Birmingham completed < 9th grade.
8.0% of adults in Birmingham completed 9-12th grade.
28.0% of adults in Birmingham completed high school / ged.
21.0% of adults in Birmingham completed some college.
8.0% of adults in Birmingham completed associate's degree.
19.0% of adults in Birmingham completed bachelor's degree.
7.0% of adults in Birmingham completed master's degree.
3.0% of adults in Birmingham completed professional degree.
2.0% of adults in Birmingham completed doctorate degree.
| Education | Birmingham | AL | USA |
|---|---|---|---|
| < 9th Grade | 4.0% | 4.0% | 4.0% |
| 9-12th Grade | 8.0% | 8.0% | 6.0% |
| High School / GED | 28.0% | 30.0% | 26.0% |
| Some College | 21.0% | 21.0% | 19.0% |
| Associate's Degree | 8.0% | 9.0% | 9.0% |
| Bachelor's Degree | 19.0% | 17.0% | 22.0% |
| Master's Degree | 7.0% | 8.0% | 10.0% |
| Professional Degree | 3.0% | 2.0% | 2.0% |
| Doctorate Degree | 2.0% | 1.0% | 2.0% |
Household Income For Birmingham, Alabama
See the full breakdown
9.1% of households in Birmingham earn Less than $10,000.
6.8% of households in Birmingham earn $10,000 to $14,999.
11.6% of households in Birmingham earn $15,000 to $24,999.
11.8% of households in Birmingham earn $25,000 to $34,999.
13.7% of households in Birmingham earn $35,000 to $49,999.
17.5% of households in Birmingham earn $50,000 to $74,999.
9.8% of households in Birmingham earn $75,000 to $99,999.
10.9% of households in Birmingham earn $100,000 to $149,999.
4.0% of households in Birmingham earn $150,000 to $199,999.
4.8% of households in Birmingham earn $200,000 or more.
| Income | Birmingham | AL | USA |
|---|---|---|---|
| Less than $10,000 | 9.1% | 6.3% | 5.0% |
| $10,000 to $14,999 | 6.8% | 4.7% | 3.4% |
| $15,000 to $24,999 | 11.6% | 8.8% | 6.3% |
| $25,000 to $34,999 | 11.8% | 8.5% | 6.6% |
| $35,000 to $49,999 | 13.7% | 11.8% | 10.1% |
| $50,000 to $74,999 | 17.5% | 16.7% | 15.5% |
| $75,000 to $99,999 | 9.8% | 12.7% | 12.6% |
| $100,000 to $149,999 | 10.9% | 15.5% | 17.5% |
| $150,000 to $199,999 | 4.0% | 7.4% | 9.6% |
| $200,000 or more | 4.8% | 7.8% | 13.4% |
Source: U.S. Census ACS 5-year estimates (2024)


