Florence SnackAbility
Overall SnackAbility
Crime in Florence summary. We use data from the FBI to determine the crime rates in Florence. Key points include:
There were 1,140 total crimes in Florence in the last reporting year.
The overall crime rate per 100,000 people in Florence is 2,646.5 / 100k people.
The violent crime rate per 100,000 people in Florence is 629.1 / 100k people.
The property crime rate per 100,000 people in Florence is 2,017.4 / 100k people.
Overall, crime in Florence is 24.88% above the national average.
Total Crimes
Above National Average
Crime In Florence Comparison Table
| Statistic | Count Raw |
Florence / 100k People |
Alabama / 100k People |
National / 100k People |
|---|---|---|---|---|
| Total Crimes Per 100K | 1,140 | 2,646.5 | 1,924.9 | 2,119.2 |
| Violent Crime | 271 | 629.1 | 359.9 | 359.0 |
| Murder | 0 | 0.0 | 8.7 | 5.0 |
| Robbery | 9 | 20.9 | 34.0 | 61.0 |
| Aggravated Assault | 246 | 571.1 | 291.4 | 256.0 |
| Property Crime | 869 | 2,017.4 | 1,565.1 | 1,760.0 |
| Burglary | 100 | 232.1 | 243.5 | 229.0 |
| Larceny | 698 | 1,620.4 | 1,148.5 | 1,272.0 |
| Car Theft | 71 | 164.8 | 173.0 | 259.0 |
Source: FBI Uniform Crime Reporting (2024)
Cost of living in Florence summary. We use data on the cost of living to determine how expensive it is to live in Florence. Real estate prices drive most of the variance in cost of living around Alabama. Key points include:
The cost of living in Florence is 88 with 100 being average.
The cost of living in Florence is 0.9x lower than the national average.
The median home value in Florence is $210,214.
The median income in Florence is $52,174.
Florence's Overall Cost Of Living
Lower Than The National Average
Cost Of Living In Florence Comparison Table
| Living Expense | Florence | Alabama | National Average |
|---|---|---|---|
| Overall | 88 | 91 | 100 |
| Services | 97 | 95 | 100 |
| Groceries | 99 | 96 | 100 |
| Health | 72 | 74 | 100 |
| Housing | 96 | 96 | 100 |
| Transportation | 98 | 95 | 100 |
| Utilities | 92 | 95 | 100 |
Source: Cost of living index, normalized to US average = 100
Florence, AL Weather
The average high in Florence is 71.2° and the average low is 48.8°.
There are 79.0 days of precipitation each year.
Expect an average of 57.7 inches of precipitation each year with 2.2 inches of snow.
| Stat | Florence |
|---|---|
| Average Annual High | 71.2 |
| Average Annual Low | 48.8 |
| Annual Precipitation Days | 79.0 |
| Average Annual Precipitation | 57.7 |
| Average Annual Snowfall | 2.2 |
Average High
Days of Rain
Source: NOAA climate normals (30-year)
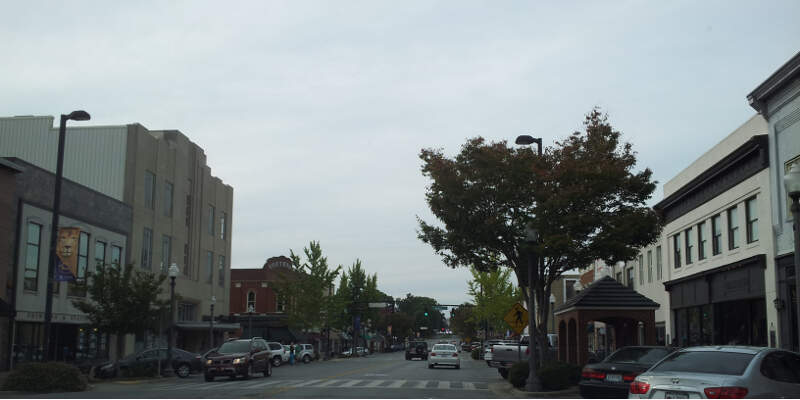
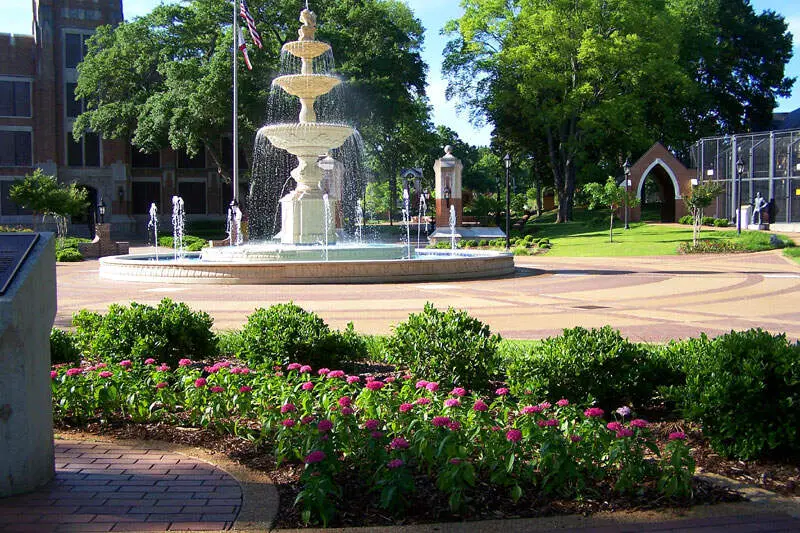
Florence, AL Photos


1 Reviews & Comments About Florence

I lived in Florence for a while and loved it. If I ever move to another place in AL that is where I will go.
Rankings & Articles For Florence


Locations Around Florence
Map Of Florence, AL
Best Places Around Florence
Corinth, MS
Population 14,323
Muscle Shoals, AL
Population 16,951
Decatur, AL
Population 57,361
Savannah, TN
Population 7,412
Athens, AL
Population 29,002
Hartselle, AL
Population 15,847
Pulaski, TN
Population 8,285
Lawrenceburg, TN
Population 11,844
Florence Demographics And Statistics
Population over time in Florence
The current population in Florence is 41,701. The population has increased 7.4% from 2010.
| Year | Population | % Change |
|---|---|---|
| 2024 | 41,701 | 1.1% |
| 2023 | 41,231 | 1.1% |
| 2022 | 40,781 | 2.7% |
| 2021 | 39,709 | -2.3% |
| 2020 | 40,652 | 0.9% |
| 2019 | 40,309 | 0.5% |
| 2018 | 40,104 | 0.7% |
| 2017 | 39,824 | -0.3% |
| 2016 | 39,938 | 0.2% |
| 2015 | 39,855 | 0.3% |
| 2014 | 39,738 | 0.5% |
| 2013 | 39,530 | 0.6% |
| 2012 | 39,288 | 0.5% |
| 2011 | 39,085 | 0.7% |
| 2010 | 38,821 | - |
Race / Ethnicity in Florence
See the full breakdown
Florence is:
70.8% White with 29,513 White residents.
15.7% African American with 6,552 African American residents.
0.2% American Indian with 93 American Indian residents.
0.9% Asian with 372 Asian residents.
0.0% Hawaiian with 0 Hawaiian residents.
0.5% Other with 224 Other residents.
5.9% Two Or More with 2,474 Two Or More residents.
5.9% Hispanic with 2,473 Hispanic residents.
| Race | Florence | AL | USA |
|---|---|---|---|
| White | 70.8% | 63.4% | 57.4% |
| African American | 15.7% | 25.6% | 11.9% |
| American Indian | 0.2% | 0.3% | 0.5% |
| Asian | 0.9% | 1.4% | 5.9% |
| Hawaiian | 0.0% | 0.0% | 0.2% |
| Other | 0.5% | 0.4% | 0.6% |
| Two Or More | 5.9% | 3.3% | 4.3% |
| Hispanic | 5.9% | 5.6% | 19.3% |
Gender in Florence
See the full breakdown
Florence is 54.6% female with 22,753 female residents.
Florence is 45.4% male with 18,948 male residents.
| Gender | Florence | AL | USA |
|---|---|---|---|
| Female | 54.6% | 51.4% | 50.5% |
| Male | 45.4% | 48.6% | 49.5% |
Highest level of educational attainment in Florence for adults over 25
See the full breakdown
4.0% of adults in Florence completed < 9th grade.
5.0% of adults in Florence completed 9-12th grade.
32.0% of adults in Florence completed high school / ged.
19.0% of adults in Florence completed some college.
6.0% of adults in Florence completed associate's degree.
21.0% of adults in Florence completed bachelor's degree.
9.0% of adults in Florence completed master's degree.
2.0% of adults in Florence completed professional degree.
2.0% of adults in Florence completed doctorate degree.
| Education | Florence | AL | USA |
|---|---|---|---|
| < 9th Grade | 4.0% | 4.0% | 4.0% |
| 9-12th Grade | 5.0% | 8.0% | 6.0% |
| High School / GED | 32.0% | 30.0% | 26.0% |
| Some College | 19.0% | 21.0% | 19.0% |
| Associate's Degree | 6.0% | 9.0% | 9.0% |
| Bachelor's Degree | 21.0% | 17.0% | 22.0% |
| Master's Degree | 9.0% | 8.0% | 10.0% |
| Professional Degree | 2.0% | 2.0% | 2.0% |
| Doctorate Degree | 2.0% | 1.0% | 2.0% |
Household Income For Florence, Alabama
See the full breakdown
8.5% of households in Florence earn Less than $10,000.
4.9% of households in Florence earn $10,000 to $14,999.
12.9% of households in Florence earn $15,000 to $24,999.
9.2% of households in Florence earn $25,000 to $34,999.
12.9% of households in Florence earn $35,000 to $49,999.
17.4% of households in Florence earn $50,000 to $74,999.
12.9% of households in Florence earn $75,000 to $99,999.
10.4% of households in Florence earn $100,000 to $149,999.
6.2% of households in Florence earn $150,000 to $199,999.
4.8% of households in Florence earn $200,000 or more.
| Income | Florence | AL | USA |
|---|---|---|---|
| Less than $10,000 | 8.5% | 6.3% | 5.0% |
| $10,000 to $14,999 | 4.9% | 4.7% | 3.4% |
| $15,000 to $24,999 | 12.9% | 8.8% | 6.3% |
| $25,000 to $34,999 | 9.2% | 8.5% | 6.6% |
| $35,000 to $49,999 | 12.9% | 11.8% | 10.1% |
| $50,000 to $74,999 | 17.4% | 16.7% | 15.5% |
| $75,000 to $99,999 | 12.9% | 12.7% | 12.6% |
| $100,000 to $149,999 | 10.4% | 15.5% | 17.5% |
| $150,000 to $199,999 | 6.2% | 7.4% | 9.6% |
| $200,000 or more | 4.8% | 7.8% | 13.4% |
Source: U.S. Census ACS 5-year estimates (2024)


