Tarrant SnackAbility
Overall SnackAbility
Cost of living in Tarrant summary. We use data on the cost of living to determine how expensive it is to live in Tarrant. Real estate prices drive most of the variance in cost of living around Alabama. Key points include:
The cost of living in Tarrant is 87 with 100 being average.
The cost of living in Tarrant is 0.9x lower than the national average.
The median home value in Tarrant is $77,450.
The median income in Tarrant is $42,070.
Tarrant's Overall Cost Of Living
Lower Than The National Average
Cost Of Living In Tarrant Comparison Table
| Living Expense | Tarrant | Alabama | National Average |
|---|---|---|---|
| Overall | 87 | 91 | 100 |
| Services | 97 | 95 | 100 |
| Groceries | 97 | 96 | 100 |
| Health | 58 | 74 | 100 |
| Housing | 98 | 96 | 100 |
| Transportation | 95 | 95 | 100 |
| Utilities | 94 | 95 | 100 |
Source: Cost of living index, normalized to US average = 100
Tarrant, AL Weather
The average high in Tarrant is 73.6° and the average low is 51.4°.
There are 78.6 days of precipitation each year.
Expect an average of 56.2 inches of precipitation each year with 1.3 inches of snow.
| Stat | Tarrant |
|---|---|
| Average Annual High | 73.6 |
| Average Annual Low | 51.4 |
| Annual Precipitation Days | 78.6 |
| Average Annual Precipitation | 56.2 |
| Average Annual Snowfall | 1.3 |
Average High
Days of Rain
Source: NOAA climate normals (30-year)
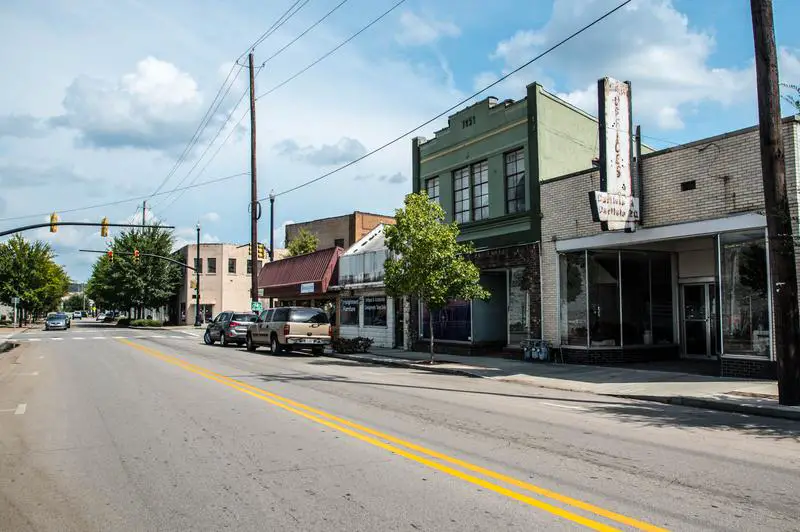
Tarrant, AL Photos
2 Reviews & Comments About Tarrant

I never wanted to move here to start with,but due to family situation I did.When I tried to move away,the 2008 housing situation collapsed, leaving me stuck with a mortgage no one else would pay.The house simply wasn't worth what I owed,so I'm stuck. There is nowhere for our children to play,too hilly.There is nothing for our teens to do,no swimming pool,nothing.Mass transit is a joke.We have been abandoned and forgotten,real facts.
The Ranch House restaurant is the best eatery here.
I LIVE in Tarrant. Was born & raised here. I moved away for 20 years, but this is HOME.
Rankings & Articles For Tarrant


Locations Around Tarrant
Map Of Tarrant, AL
Best Places Around Tarrant
Bessemer, AL
Population 25,400
Birmingham, AL
Population 198,173
Fairfield, AL
Population 9,728
Irondale, AL
Population 13,464
Moody, AL
Population 13,488
Leeds, AL
Population 12,028
Center Point, AL
Population 15,914
Hueytown, AL
Population 16,414
Trussville, AL
Population 26,673
Pelham, AL
Population 24,827
Tarrant Demographics And Statistics
Population over time in Tarrant
The current population in Tarrant is 5,925. The population has decreased 9.2% from 2010.
| Year | Population | % Change |
|---|---|---|
| 2024 | 5,925 | -1.5% |
| 2023 | 6,014 | -1.0% |
| 2022 | 6,077 | -1.0% |
| 2021 | 6,137 | -1.3% |
| 2020 | 6,216 | 0.7% |
| 2019 | 6,174 | -0.6% |
| 2018 | 6,212 | -0.4% |
| 2017 | 6,238 | -0.5% |
| 2016 | 6,271 | -0.1% |
| 2015 | 6,278 | -0.8% |
| 2014 | 6,331 | -0.7% |
| 2013 | 6,374 | -0.6% |
| 2012 | 6,412 | -0.9% |
| 2011 | 6,470 | -0.8% |
| 2010 | 6,524 | - |
Race / Ethnicity in Tarrant
See the full breakdown
Tarrant is:
31.9% White with 1,888 White residents.
45.0% African American with 2,668 African American residents.
0.0% American Indian with 0 American Indian residents.
0.0% Asian with 0 Asian residents.
0.5% Hawaiian with 29 Hawaiian residents.
0.9% Other with 51 Other residents.
0.4% Two Or More with 21 Two Or More residents.
21.4% Hispanic with 1,268 Hispanic residents.
| Race | Tarrant | AL | USA |
|---|---|---|---|
| White | 31.9% | 63.4% | 57.4% |
| African American | 45.0% | 25.6% | 11.9% |
| American Indian | 0.0% | 0.3% | 0.5% |
| Asian | 0.0% | 1.4% | 5.9% |
| Hawaiian | 0.5% | 0.0% | 0.2% |
| Other | 0.9% | 0.4% | 0.6% |
| Two Or More | 0.4% | 3.3% | 4.3% |
| Hispanic | 21.4% | 5.6% | 19.3% |
Gender in Tarrant
See the full breakdown
Tarrant is 53.2% female with 3,154 female residents.
Tarrant is 46.8% male with 2,771 male residents.
| Gender | Tarrant | AL | USA |
|---|---|---|---|
| Female | 53.2% | 51.4% | 50.5% |
| Male | 46.8% | 48.6% | 49.5% |
Highest level of educational attainment in Tarrant for adults over 25
See the full breakdown
9.0% of adults in Tarrant completed < 9th grade.
18.0% of adults in Tarrant completed 9-12th grade.
31.0% of adults in Tarrant completed high school / ged.
26.0% of adults in Tarrant completed some college.
9.0% of adults in Tarrant completed associate's degree.
7.0% of adults in Tarrant completed bachelor's degree.
0.0% of adults in Tarrant completed master's degree.
0.0% of adults in Tarrant completed professional degree.
0.0% of adults in Tarrant completed doctorate degree.
| Education | Tarrant | AL | USA |
|---|---|---|---|
| < 9th Grade | 9.0% | 4.0% | 4.0% |
| 9-12th Grade | 18.0% | 8.0% | 6.0% |
| High School / GED | 31.0% | 30.0% | 26.0% |
| Some College | 26.0% | 21.0% | 19.0% |
| Associate's Degree | 9.0% | 9.0% | 9.0% |
| Bachelor's Degree | 7.0% | 17.0% | 22.0% |
| Master's Degree | 0.0% | 8.0% | 10.0% |
| Professional Degree | 0.0% | 2.0% | 2.0% |
| Doctorate Degree | 0.0% | 1.0% | 2.0% |
Household Income For Tarrant, Alabama
See the full breakdown
13.1% of households in Tarrant earn Less than $10,000.
5.3% of households in Tarrant earn $10,000 to $14,999.
13.0% of households in Tarrant earn $15,000 to $24,999.
10.9% of households in Tarrant earn $25,000 to $34,999.
13.8% of households in Tarrant earn $35,000 to $49,999.
18.4% of households in Tarrant earn $50,000 to $74,999.
15.3% of households in Tarrant earn $75,000 to $99,999.
6.8% of households in Tarrant earn $100,000 to $149,999.
1.5% of households in Tarrant earn $150,000 to $199,999.
1.9% of households in Tarrant earn $200,000 or more.
| Income | Tarrant | AL | USA |
|---|---|---|---|
| Less than $10,000 | 13.1% | 6.3% | 5.0% |
| $10,000 to $14,999 | 5.3% | 4.7% | 3.4% |
| $15,000 to $24,999 | 13.0% | 8.8% | 6.3% |
| $25,000 to $34,999 | 10.9% | 8.5% | 6.6% |
| $35,000 to $49,999 | 13.8% | 11.8% | 10.1% |
| $50,000 to $74,999 | 18.4% | 16.7% | 15.5% |
| $75,000 to $99,999 | 15.3% | 12.7% | 12.6% |
| $100,000 to $149,999 | 6.8% | 15.5% | 17.5% |
| $150,000 to $199,999 | 1.5% | 7.4% | 9.6% |
| $200,000 or more | 1.9% | 7.8% | 13.4% |
Source: U.S. Census ACS 5-year estimates (2024)


