Hot Springs SnackAbility
Overall SnackAbility
Crime in Hot Springs summary. We use data from the FBI to determine the crime rates in Hot Springs. Key points include:
There were 1,785 total crimes in Hot Springs in the last reporting year.
The overall crime rate per 100,000 people in Hot Springs is 4,697.2 / 100k people.
The violent crime rate per 100,000 people in Hot Springs is 534.2 / 100k people.
The property crime rate per 100,000 people in Hot Springs is 4,163.0 / 100k people.
Overall, crime in Hot Springs is 121.65% above the national average.
Total Crimes
Above National Average
Crime In Hot Springs Comparison Table
| Statistic | Count Raw |
Hot Springs / 100k People |
Arkansas / 100k People |
National / 100k People |
|---|---|---|---|---|
| Total Crimes Per 100K | 1,785 | 4,697.2 | 2,508.9 | 2,119.2 |
| Violent Crime | 203 | 534.2 | 579.4 | 359.0 |
| Murder | 6 | 15.8 | 7.3 | 5.0 |
| Robbery | 20 | 52.6 | 38.6 | 61.0 |
| Aggravated Assault | 134 | 352.6 | 463.5 | 256.0 |
| Property Crime | 1,582 | 4,163.0 | 1,929.5 | 1,760.0 |
| Burglary | 267 | 702.6 | 352.7 | 229.0 |
| Larceny | 1,193 | 3,139.4 | 1,400.0 | 1,272.0 |
| Car Theft | 122 | 321.0 | 176.8 | 259.0 |
Source: FBI Uniform Crime Reporting (2024)
Cost of living in Hot Springs summary. We use data on the cost of living to determine how expensive it is to live in Hot Springs. Real estate prices drive most of the variance in cost of living around Arkansas. Key points include:
The cost of living in Hot Springs is 89 with 100 being average.
The cost of living in Hot Springs is 0.9x lower than the national average.
The median home value in Hot Springs is $243,825.
The median income in Hot Springs is $47,760.
Hot Springs's Overall Cost Of Living
Lower Than The National Average
Cost Of Living In Hot Springs Comparison Table
| Living Expense | Hot Springs | Arkansas | National Average |
|---|---|---|---|
| Overall | 89 | 85 | 100 |
| Services | 98 | 95 | 100 |
| Groceries | 97 | 93 | 100 |
| Health | 73 | 68 | 100 |
| Housing | 95 | 96 | 100 |
| Transportation | 92 | 92 | 100 |
| Utilities | 92 | 92 | 100 |
Source: Cost of living index, normalized to US average = 100
Hot Springs, AR Weather
The average high in Hot Springs is 73.0° and the average low is 49.6°.
There are 72.7 days of precipitation each year.
Expect an average of 54.4 inches of precipitation each year with 2.7 inches of snow.
| Stat | Hot Springs |
|---|---|
| Average Annual High | 73.0 |
| Average Annual Low | 49.6 |
| Annual Precipitation Days | 72.7 |
| Average Annual Precipitation | 54.4 |
| Average Annual Snowfall | 2.7 |
Average High
Days of Rain
Source: NOAA climate normals (30-year)
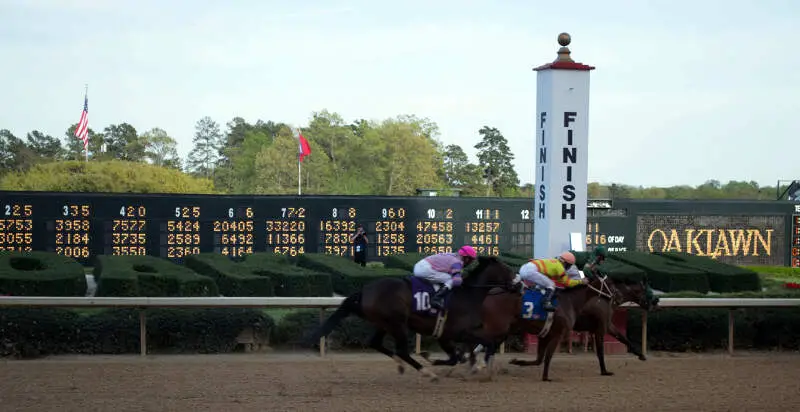
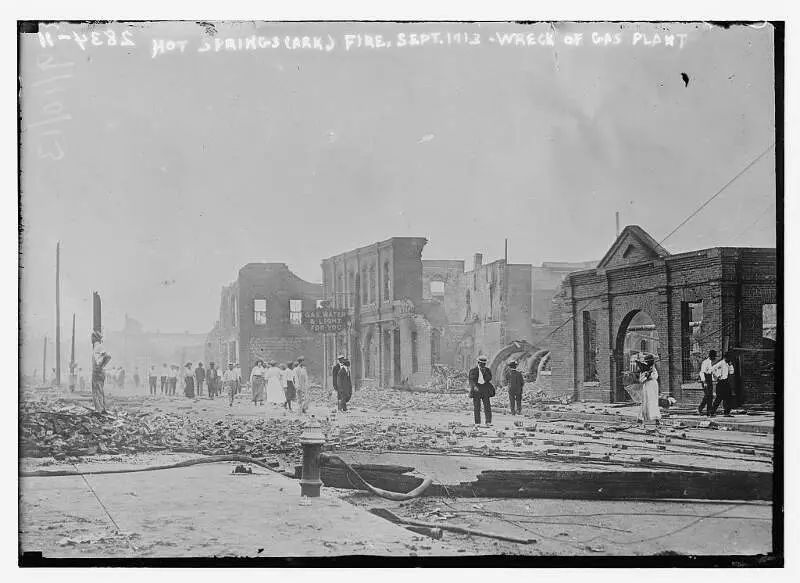
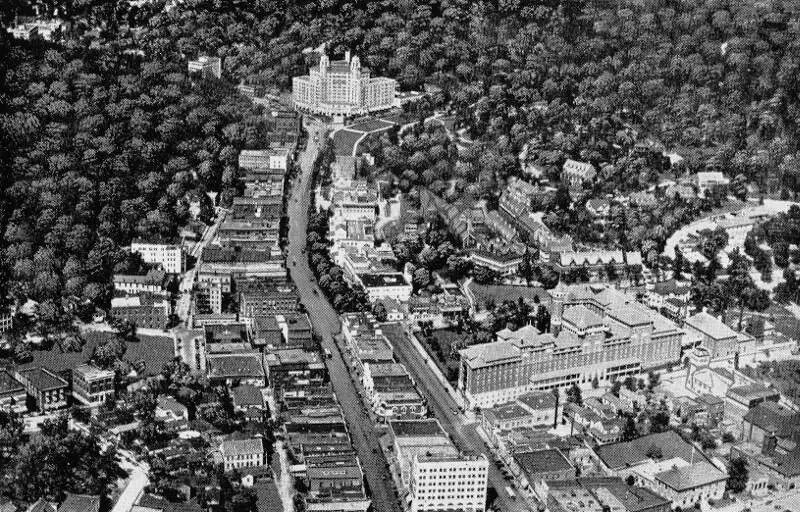
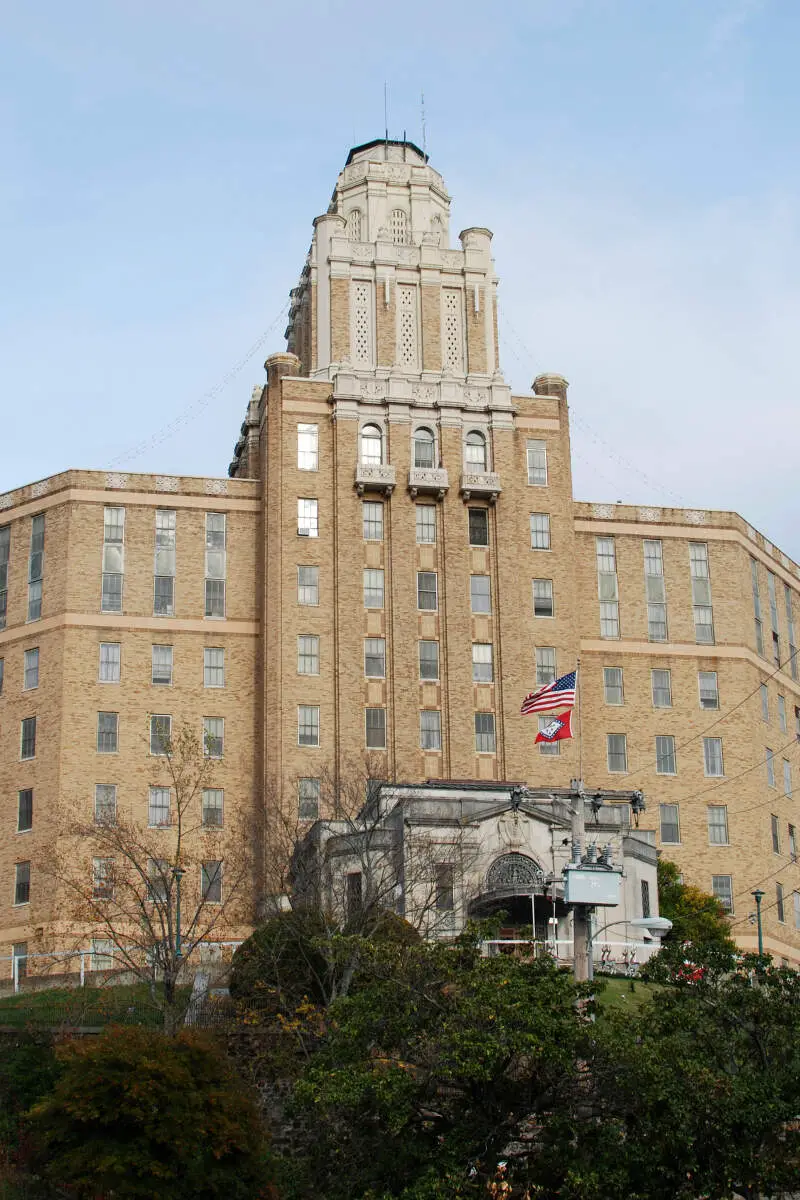
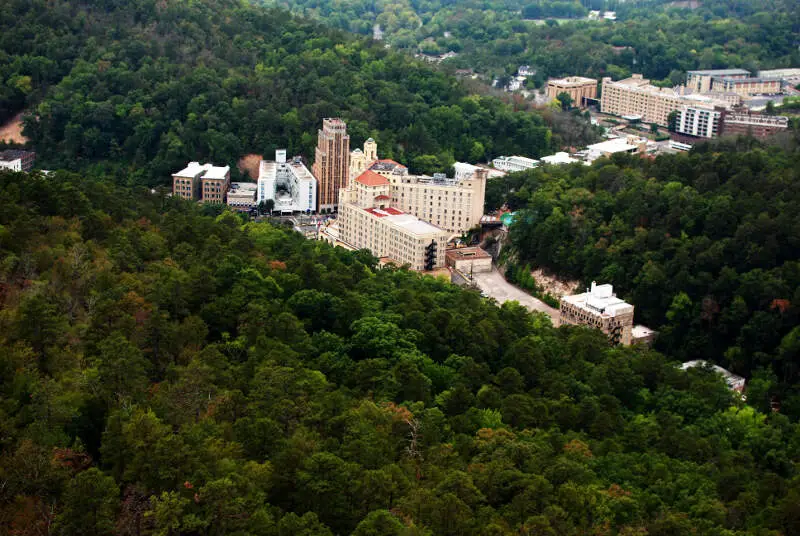
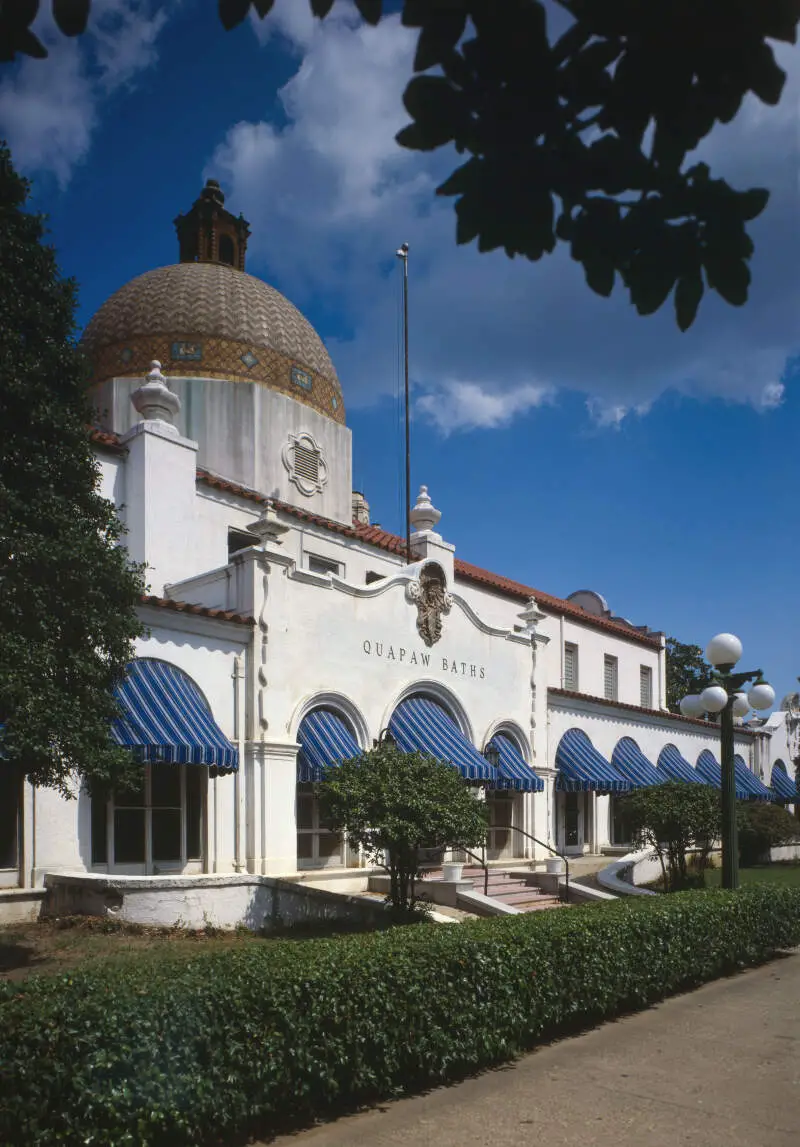
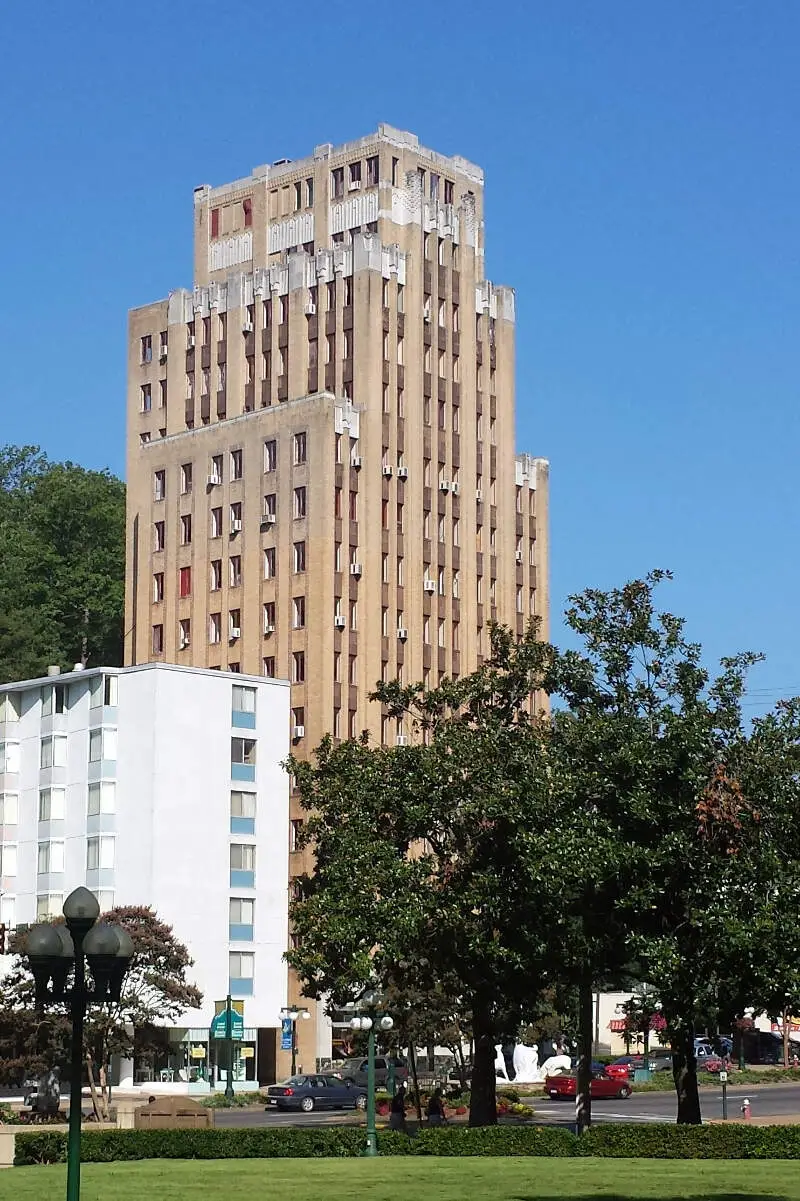
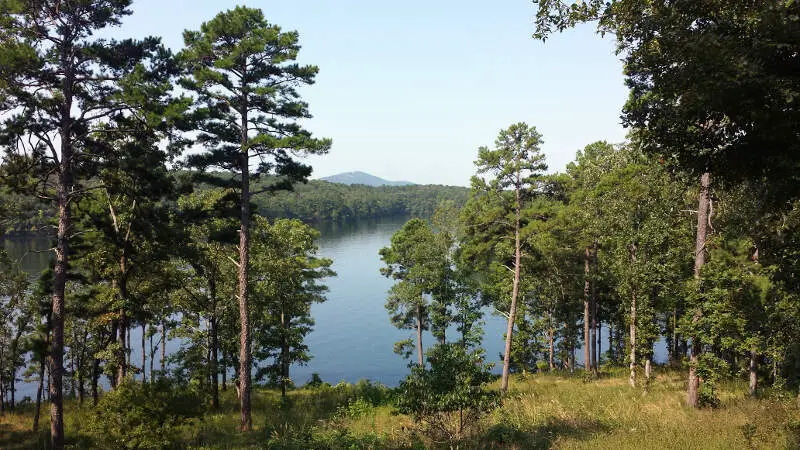
Hot Springs, AR Photos
Rankings & Articles For Hot Springs


Locations Around Hot Springs
Map Of Hot Springs, AR
Best Places Around Hot Springs
Maumelle, AR
Population 19,373
Benton, AR
Population 36,595
Little Rock, AR
Population 203,436
Bryant, AR
Population 21,504
Malvern, AR
Population 10,953
East End, AR
Population 6,912
Arkadelphia, AR
Population 10,099
Morrilton, AR
Population 7,080
Hot Springs Demographics And Statistics
Population over time in Hot Springs
The current population in Hot Springs is 37,920. The population has increased 6.5% from 2010.
| Year | Population | % Change |
|---|---|---|
| 2024 | 37,920 | -0.3% |
| 2023 | 38,023 | -0.0% |
| 2022 | 38,025 | -0.1% |
| 2021 | 38,050 | -1.7% |
| 2020 | 38,697 | 0.4% |
| 2019 | 38,559 | 4.3% |
| 2018 | 36,969 | 0.5% |
| 2017 | 36,780 | 0.2% |
| 2016 | 36,711 | 3.3% |
| 2015 | 35,539 | 0.1% |
| 2014 | 35,486 | 0.1% |
| 2013 | 35,451 | -0.0% |
| 2012 | 35,459 | -0.2% |
| 2011 | 35,542 | -0.2% |
| 2010 | 35,604 | - |
Race / Ethnicity in Hot Springs
See the full breakdown
Hot Springs is:
66.6% White with 25,238 White residents.
15.6% African American with 5,905 African American residents.
0.4% American Indian with 155 American Indian residents.
1.2% Asian with 443 Asian residents.
0.0% Hawaiian with 11 Hawaiian residents.
0.2% Other with 61 Other residents.
5.3% Two Or More with 2,017 Two Or More residents.
10.8% Hispanic with 4,090 Hispanic residents.
| Race | Hot Springs | AR | USA |
|---|---|---|---|
| White | 66.6% | 67.4% | 57.4% |
| African American | 15.6% | 14.6% | 11.9% |
| American Indian | 0.4% | 0.3% | 0.5% |
| Asian | 1.2% | 1.6% | 5.9% |
| Hawaiian | 0.0% | 0.4% | 0.2% |
| Other | 0.2% | 0.3% | 0.6% |
| Two Or More | 5.3% | 6.3% | 4.3% |
| Hispanic | 10.8% | 9.0% | 19.3% |
Gender in Hot Springs
See the full breakdown
Hot Springs is 53.6% female with 20,328 female residents.
Hot Springs is 46.4% male with 17,591 male residents.
| Gender | Hot Springs | AR | USA |
|---|---|---|---|
| Female | 53.6% | 50.6% | 50.5% |
| Male | 46.4% | 49.4% | 49.5% |
Highest level of educational attainment in Hot Springs for adults over 25
See the full breakdown
3.0% of adults in Hot Springs completed < 9th grade.
7.0% of adults in Hot Springs completed 9-12th grade.
30.0% of adults in Hot Springs completed high school / ged.
23.0% of adults in Hot Springs completed some college.
10.0% of adults in Hot Springs completed associate's degree.
17.0% of adults in Hot Springs completed bachelor's degree.
7.0% of adults in Hot Springs completed master's degree.
2.0% of adults in Hot Springs completed professional degree.
1.0% of adults in Hot Springs completed doctorate degree.
| Education | Hot Springs | AR | USA |
|---|---|---|---|
| < 9th Grade | 3.0% | 5.0% | 4.0% |
| 9-12th Grade | 7.0% | 7.0% | 6.0% |
| High School / GED | 30.0% | 34.0% | 26.0% |
| Some College | 23.0% | 21.0% | 19.0% |
| Associate's Degree | 10.0% | 8.0% | 9.0% |
| Bachelor's Degree | 17.0% | 16.0% | 22.0% |
| Master's Degree | 7.0% | 7.0% | 10.0% |
| Professional Degree | 2.0% | 1.0% | 2.0% |
| Doctorate Degree | 1.0% | 1.0% | 2.0% |
Household Income For Hot Springs, Arkansas
See the full breakdown
7.8% of households in Hot Springs earn Less than $10,000.
6.3% of households in Hot Springs earn $10,000 to $14,999.
14.0% of households in Hot Springs earn $15,000 to $24,999.
11.6% of households in Hot Springs earn $25,000 to $34,999.
13.1% of households in Hot Springs earn $35,000 to $49,999.
16.6% of households in Hot Springs earn $50,000 to $74,999.
11.9% of households in Hot Springs earn $75,000 to $99,999.
11.0% of households in Hot Springs earn $100,000 to $149,999.
4.7% of households in Hot Springs earn $150,000 to $199,999.
3.1% of households in Hot Springs earn $200,000 or more.
| Income | Hot Springs | AR | USA |
|---|---|---|---|
| Less than $10,000 | 7.8% | 6.1% | 5.0% |
| $10,000 to $14,999 | 6.3% | 4.9% | 3.4% |
| $15,000 to $24,999 | 14.0% | 8.9% | 6.3% |
| $25,000 to $34,999 | 11.6% | 9.1% | 6.6% |
| $35,000 to $49,999 | 13.1% | 12.9% | 10.1% |
| $50,000 to $74,999 | 16.6% | 17.4% | 15.5% |
| $75,000 to $99,999 | 11.9% | 12.8% | 12.6% |
| $100,000 to $149,999 | 11.0% | 15.0% | 17.5% |
| $150,000 to $199,999 | 4.7% | 6.2% | 9.6% |
| $200,000 or more | 3.1% | 6.7% | 13.4% |
Source: U.S. Census ACS 5-year estimates (2024)


