Cave Creek SnackAbility
Overall SnackAbility
Cost of living in Cave Creek summary. We use data on the cost of living to determine how expensive it is to live in Cave Creek. Real estate prices drive most of the variance in cost of living around Arizona. Key points include:
The cost of living in Cave Creek is 127 with 100 being average.
The cost of living in Cave Creek is 1.3x higher than the national average.
The median home value in Cave Creek is $1,054,561.
The median income in Cave Creek is $107,067.
Cave Creek's Overall Cost Of Living
Higher Than The National Average
Cost Of Living In Cave Creek Comparison Table
| Living Expense | Cave Creek | Arizona | National Average |
|---|---|---|---|
| Overall | 127 | 100 | 100 |
| Services | 101 | 99 | 100 |
| Groceries | 102 | 99 | 100 |
| Health | 185 | 97 | 100 |
| Housing | 104 | 104 | 100 |
| Transportation | 112 | 113 | 100 |
| Utilities | 109 | 104 | 100 |
Source: Cost of living index, normalized to US average = 100
Cave Creek, AZ Weather
The average high in Cave Creek is 85.8° and the average low is 58.1°.
There are 20.6 days of precipitation each year.
Expect an average of 9.3 inches of precipitation each year with 0.0 inches of snow.
| Stat | Cave Creek |
|---|---|
| Average Annual High | 85.8 |
| Average Annual Low | 58.1 |
| Annual Precipitation Days | 20.6 |
| Average Annual Precipitation | 9.3 |
| Average Annual Snowfall | 0.0 |
Average High
Days of Rain
Source: NOAA climate normals (30-year)
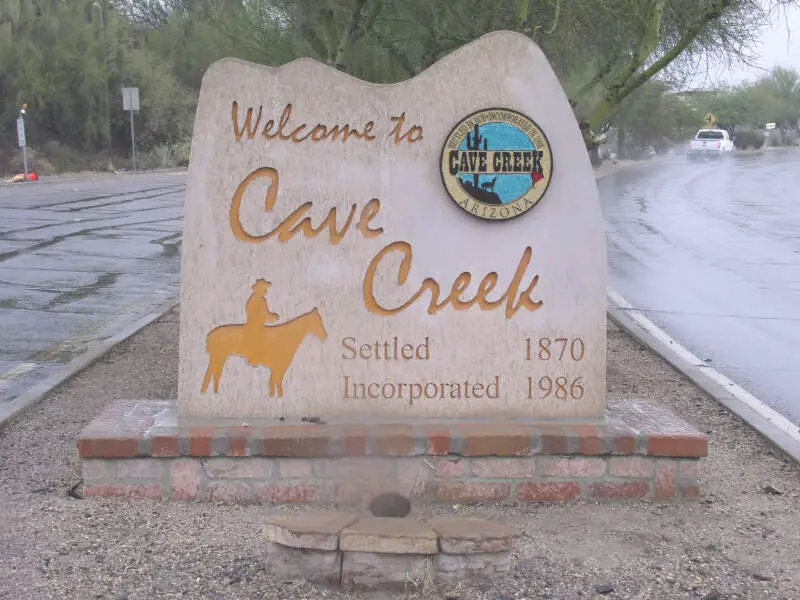
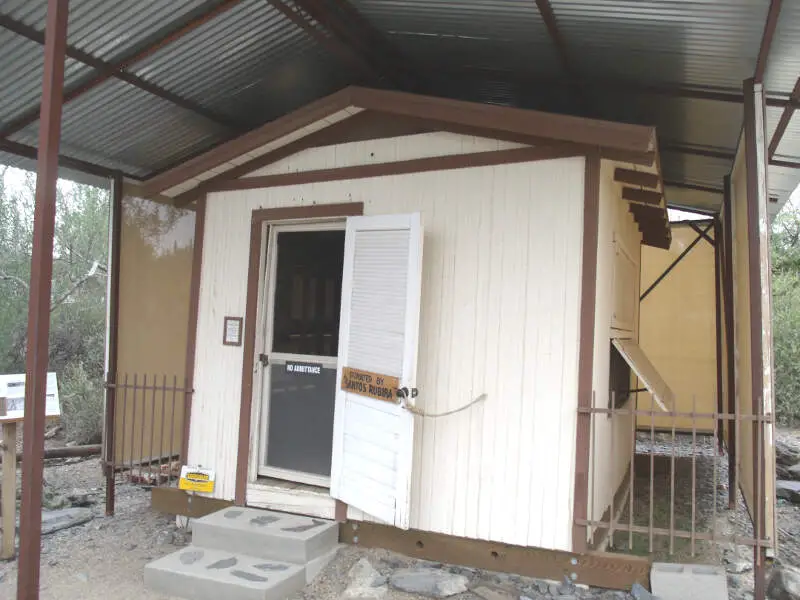
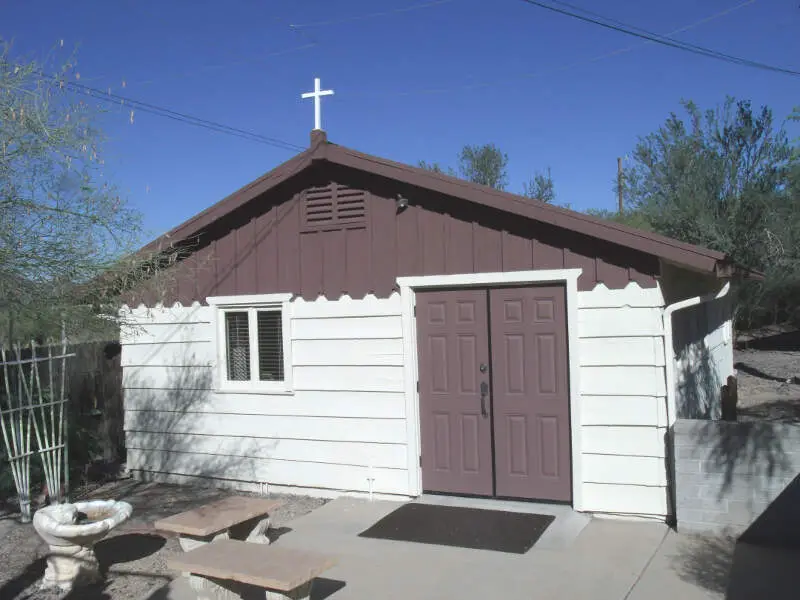
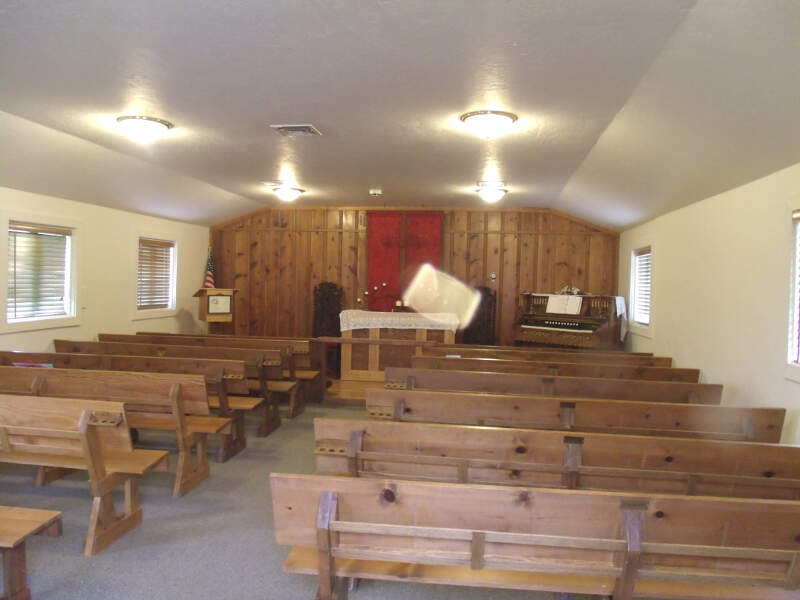
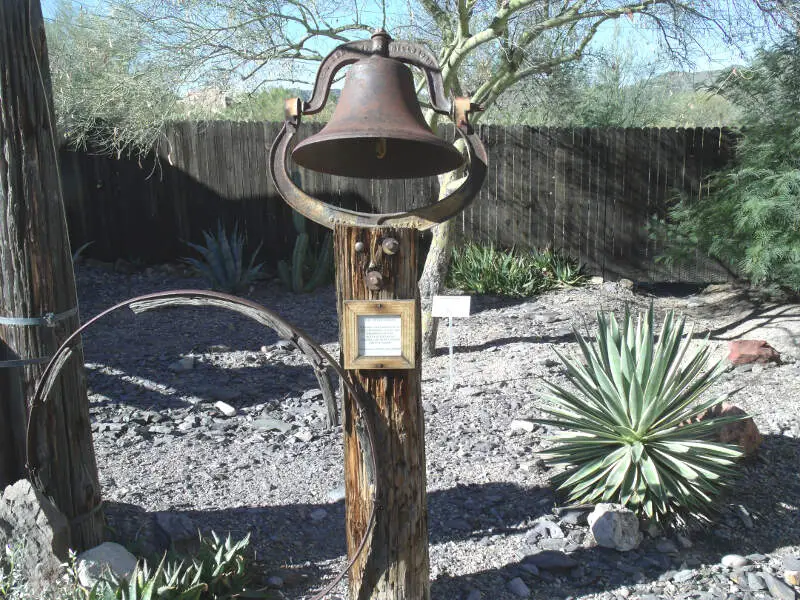
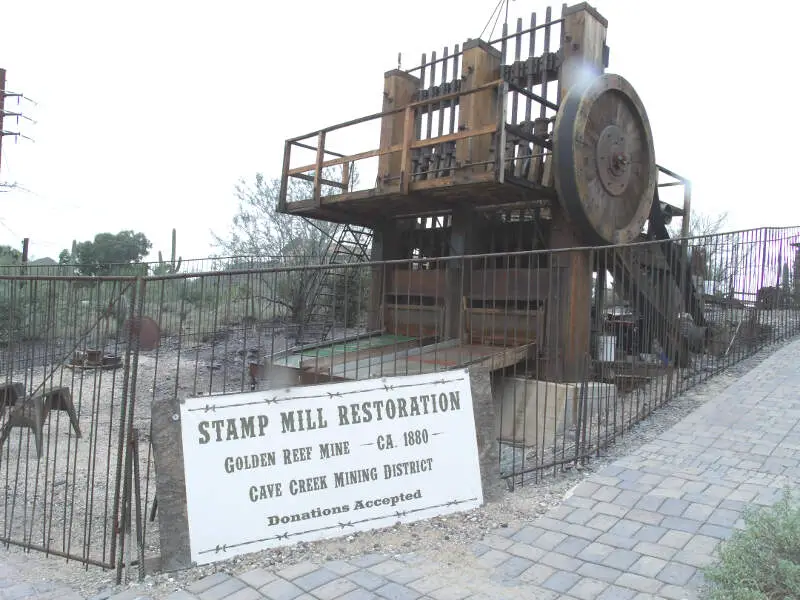
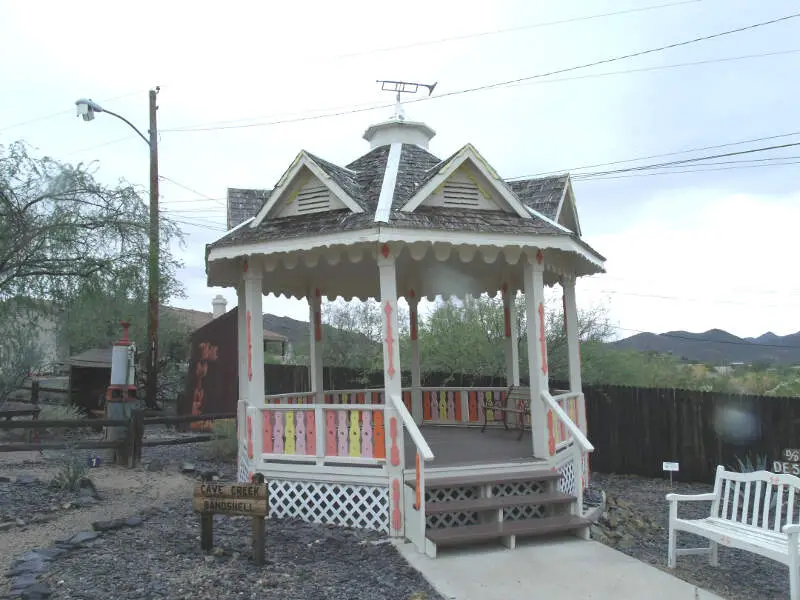
Cave Creek, AZ Photos

Rankings & Articles For Cave Creek


Locations Around Cave Creek
Map Of Cave Creek, AZ
Best Places Around Cave Creek
Scottsdale, AZ
Population 243,821
New River, AZ
Population 18,240
Peoria, AZ
Population 196,906
Paradise Valley, AZ
Population 12,611
Phoenix, AZ
Population 1,642,323
Anthem, AZ
Population 22,584
Cave Creek Demographics And Statistics
Population over time in Cave Creek
The current population in Cave Creek is 5,091. The population has increased 3.7% from 2010.
| Year | Population | % Change |
|---|---|---|
| 2024 | 5,091 | 1.2% |
| 2023 | 5,033 | 1.3% |
| 2022 | 4,966 | 0.7% |
| 2021 | 4,933 | -14.4% |
| 2020 | 5,766 | 1.7% |
| 2019 | 5,670 | 1.8% |
| 2018 | 5,569 | 2.7% |
| 2017 | 5,423 | 2.8% |
| 2016 | 5,275 | 3.0% |
| 2015 | 5,122 | 2.2% |
| 2014 | 5,014 | 1.2% |
| 2013 | 4,955 | -1.7% |
| 2012 | 5,041 | 1.3% |
| 2011 | 4,978 | 1.4% |
| 2010 | 4,911 | - |
Race / Ethnicity in Cave Creek
See the full breakdown
Cave Creek is:
88.3% White with 4,497 White residents.
1.4% African American with 73 African American residents.
0.0% American Indian with 0 American Indian residents.
1.2% Asian with 60 Asian residents.
0.0% Hawaiian with 0 Hawaiian residents.
1.0% Other with 52 Other residents.
4.0% Two Or More with 203 Two Or More residents.
4.0% Hispanic with 206 Hispanic residents.
| Race | Cave Creek | AZ | USA |
|---|---|---|---|
| White | 88.3% | 52.6% | 57.4% |
| African American | 1.4% | 4.4% | 11.9% |
| American Indian | 0.0% | 3.2% | 0.5% |
| Asian | 1.2% | 3.5% | 5.9% |
| Hawaiian | 0.0% | 0.2% | 0.2% |
| Other | 1.0% | 0.5% | 0.6% |
| Two Or More | 4.0% | 4.4% | 4.3% |
| Hispanic | 4.0% | 31.4% | 19.3% |
Gender in Cave Creek
See the full breakdown
Cave Creek is 49.0% female with 2,494 female residents.
Cave Creek is 51.0% male with 2,597 male residents.
| Gender | Cave Creek | AZ | USA |
|---|---|---|---|
| Female | 49.0% | 50.1% | 50.5% |
| Male | 51.0% | 49.9% | 49.5% |
Highest level of educational attainment in Cave Creek for adults over 25
See the full breakdown
0.0% of adults in Cave Creek completed < 9th grade.
1.0% of adults in Cave Creek completed 9-12th grade.
20.0% of adults in Cave Creek completed high school / ged.
21.0% of adults in Cave Creek completed some college.
5.0% of adults in Cave Creek completed associate's degree.
30.0% of adults in Cave Creek completed bachelor's degree.
11.0% of adults in Cave Creek completed master's degree.
7.0% of adults in Cave Creek completed professional degree.
5.0% of adults in Cave Creek completed doctorate degree.
| Education | Cave Creek | AZ | USA |
|---|---|---|---|
| < 9th Grade | 0.0% | 6.0% | 4.0% |
| 9-12th Grade | 1.0% | 6.0% | 6.0% |
| High School / GED | 20.0% | 23.0% | 26.0% |
| Some College | 21.0% | 23.0% | 19.0% |
| Associate's Degree | 5.0% | 9.0% | 9.0% |
| Bachelor's Degree | 30.0% | 20.0% | 22.0% |
| Master's Degree | 11.0% | 9.0% | 10.0% |
| Professional Degree | 7.0% | 2.0% | 2.0% |
| Doctorate Degree | 5.0% | 2.0% | 2.0% |
Household Income For Cave Creek, Arizona
See the full breakdown
5.5% of households in Cave Creek earn Less than $10,000.
0.0% of households in Cave Creek earn $10,000 to $14,999.
5.3% of households in Cave Creek earn $15,000 to $24,999.
8.2% of households in Cave Creek earn $25,000 to $34,999.
5.2% of households in Cave Creek earn $35,000 to $49,999.
13.5% of households in Cave Creek earn $50,000 to $74,999.
9.0% of households in Cave Creek earn $75,000 to $99,999.
17.6% of households in Cave Creek earn $100,000 to $149,999.
11.8% of households in Cave Creek earn $150,000 to $199,999.
23.9% of households in Cave Creek earn $200,000 or more.
| Income | Cave Creek | AZ | USA |
|---|---|---|---|
| Less than $10,000 | 5.5% | 5.0% | 5.0% |
| $10,000 to $14,999 | 0.0% | 2.7% | 3.4% |
| $15,000 to $24,999 | 5.3% | 5.8% | 6.3% |
| $25,000 to $34,999 | 8.2% | 6.6% | 6.6% |
| $35,000 to $49,999 | 5.2% | 10.5% | 10.1% |
| $50,000 to $74,999 | 13.5% | 16.5% | 15.5% |
| $75,000 to $99,999 | 9.0% | 13.5% | 12.6% |
| $100,000 to $149,999 | 17.6% | 18.4% | 17.5% |
| $150,000 to $199,999 | 11.8% | 9.4% | 9.6% |
| $200,000 or more | 23.9% | 11.6% | 13.4% |
Source: U.S. Census ACS 5-year estimates (2024)


