Compare Phoenix to…
Phoenix SnackAbility
Overall SnackAbility
Crime in Phoenix summary. We use data from the FBI to determine the crime rates in Phoenix. Key points include:
There were 51,962 total crimes in Phoenix in the last reporting year.
The overall crime rate per 100,000 people in Phoenix is 3,125.0 / 100k people.
The violent crime rate per 100,000 people in Phoenix is 799.6 / 100k people.
The property crime rate per 100,000 people in Phoenix is 2,325.3 / 100k people.
Overall, crime in Phoenix is 47.46% above the national average.
Total Crimes
Above National Average
Crime In Phoenix Comparison Table
| Statistic | Count Raw |
Phoenix / 100k People |
Arizona / 100k People |
National / 100k People |
|---|---|---|---|---|
| Total Crimes Per 100K | 51,962 | 3,125.0 | 2,214.0 | 2,119.2 |
| Violent Crime | 13,296 | 799.6 | 421.9 | 359.0 |
| Murder | 139 | 8.4 | 4.9 | 5.0 |
| Robbery | 3,020 | 181.6 | 64.6 | 61.0 |
| Aggravated Assault | 9,068 | 545.3 | 312.4 | 256.0 |
| Property Crime | 38,666 | 2,325.3 | 1,792.1 | 1,760.0 |
| Burglary | 5,274 | 317.2 | 217.8 | 229.0 |
| Larceny | 26,308 | 1,582.1 | 1,329.9 | 1,272.0 |
| Car Theft | 7,084 | 426.0 | 244.4 | 259.0 |
Source: FBI Uniform Crime Reporting (2024)
Cost of living in Phoenix summary. We use data on the cost of living to determine how expensive it is to live in Phoenix. Real estate prices drive most of the variance in cost of living around Arizona. Key points include:
The cost of living in Phoenix is 111 with 100 being average.
The cost of living in Phoenix is 1.1x higher than the national average.
The median home value in Phoenix is $410,168.
The median income in Phoenix is $81,332.
Phoenix's Overall Cost Of Living
Higher Than The National Average
Cost Of Living In Phoenix Comparison Table
| Living Expense | Phoenix | Arizona | National Average |
|---|---|---|---|
| Overall | 111 | 100 | 100 |
| Services | 105 | 99 | 100 |
| Groceries | 104 | 99 | 100 |
| Health | 133 | 97 | 100 |
| Housing | 106 | 104 | 100 |
| Transportation | 112 | 113 | 100 |
| Utilities | 103 | 104 | 100 |
Source: Cost of living index, normalized to US average = 100
Phoenix, AZ Weather
The average high in Phoenix is 85.8° and the average low is 58.1°.
There are 20.6 days of precipitation each year.
Expect an average of 9.3 inches of precipitation each year with 0.0 inches of snow.
| Stat | Phoenix |
|---|---|
| Average Annual High | 85.8 |
| Average Annual Low | 58.1 |
| Annual Precipitation Days | 20.6 |
| Average Annual Precipitation | 9.3 |
| Average Annual Snowfall | 0.0 |
Average High
Days of Rain
Source: NOAA climate normals (30-year)
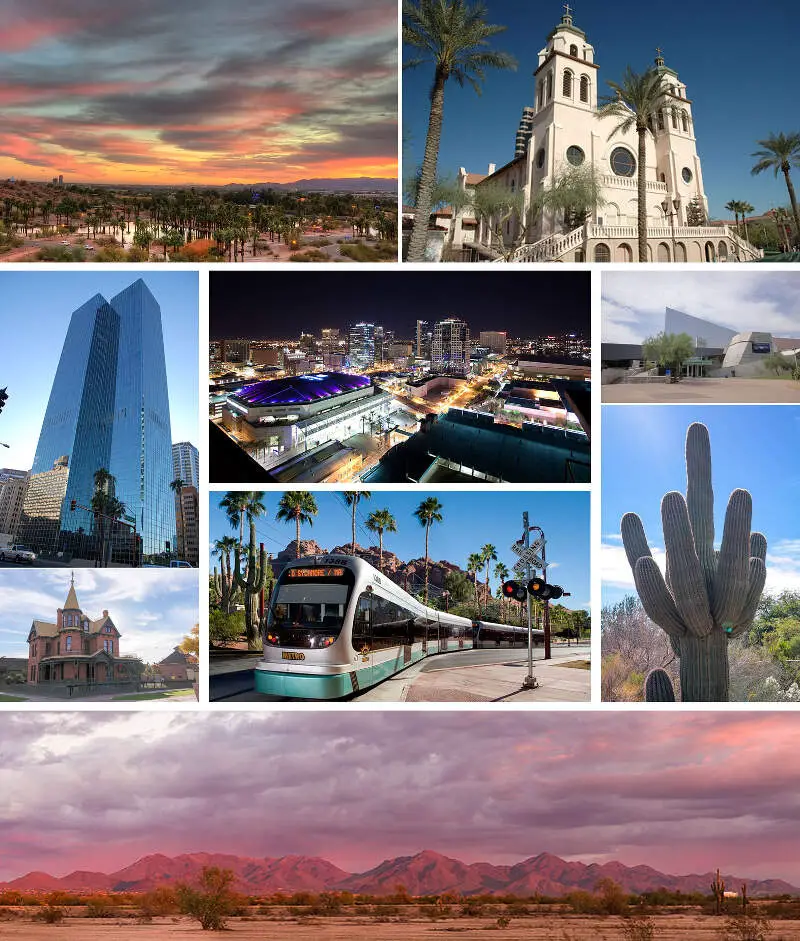
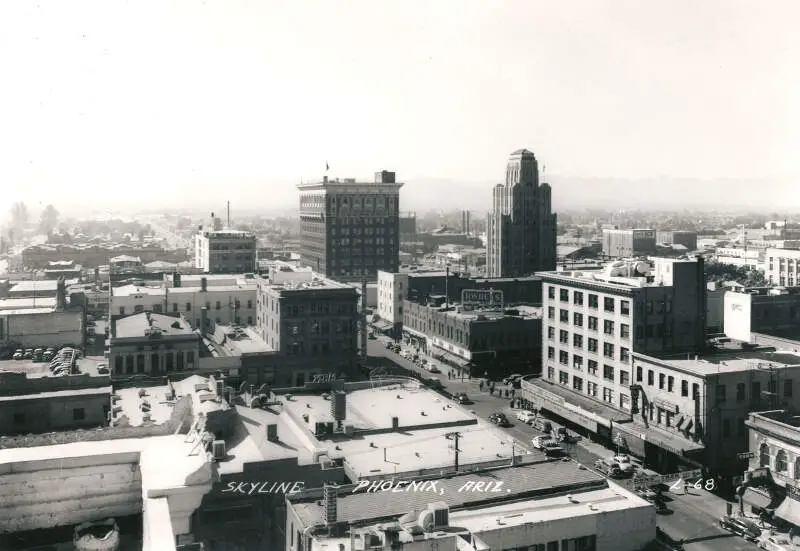
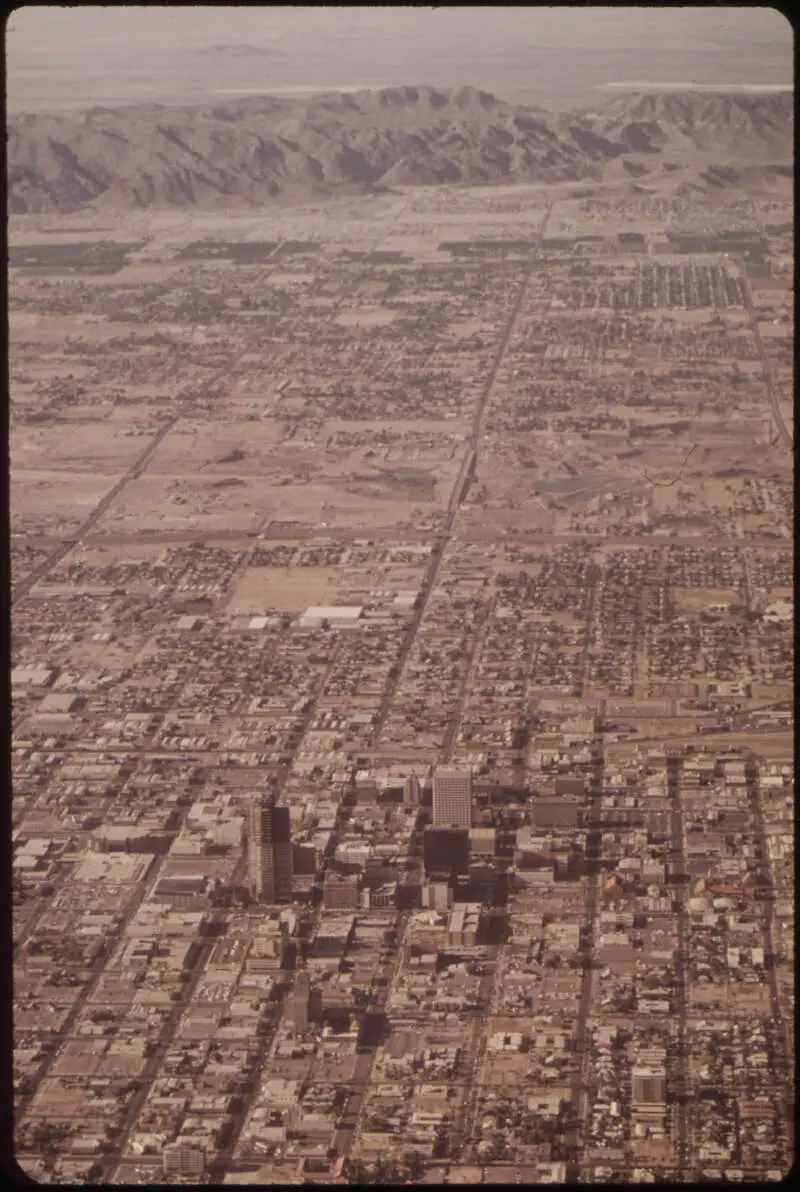
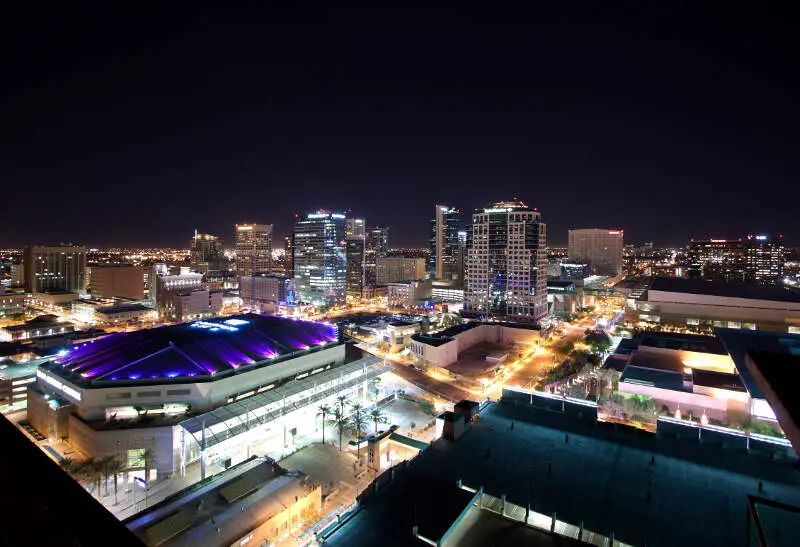
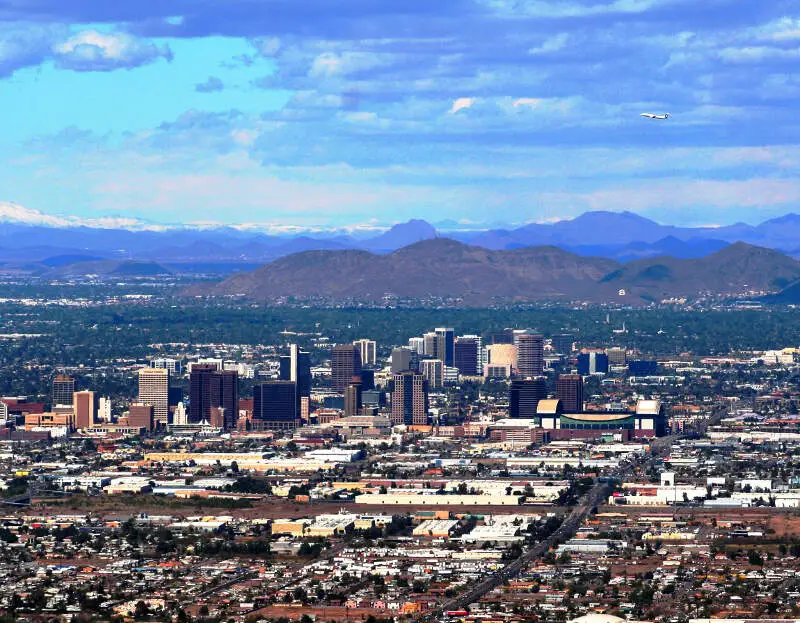
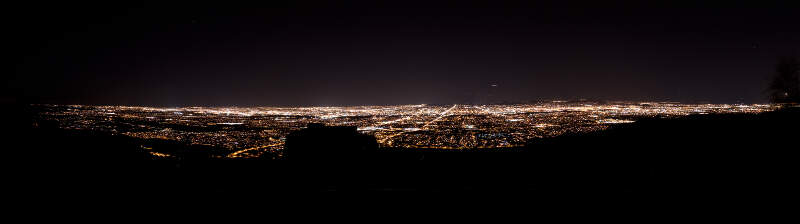
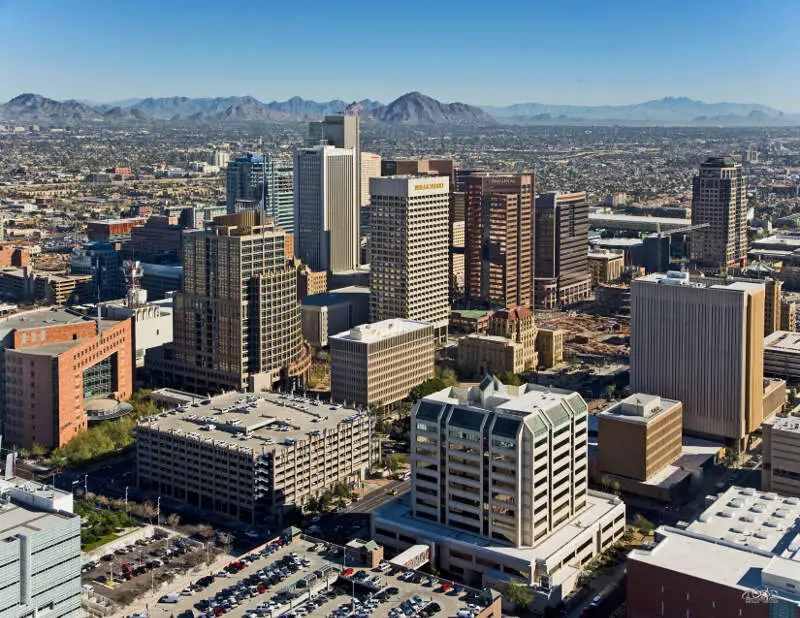
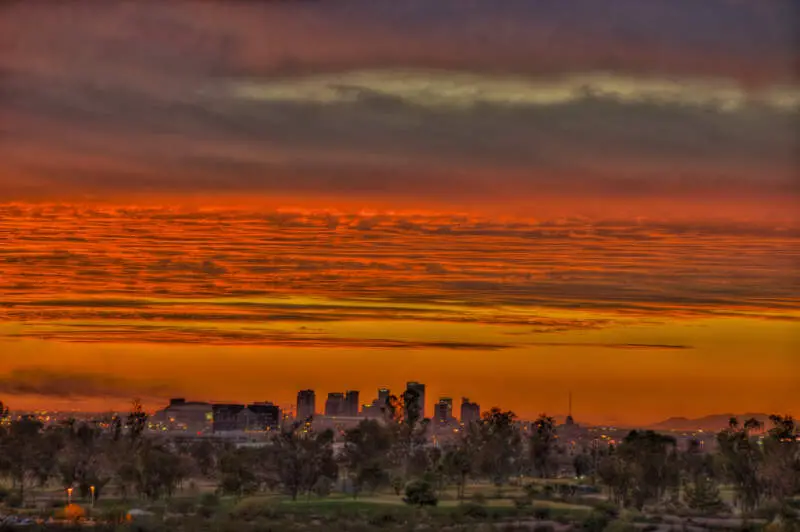
Phoenix, AZ Photos

9 Reviews & Comments About Phoenix

Phoenix, AZ is definitely a lazy city compared to other cities I've lived. The people are underacheivers. Most didn't go to college. People always asks for favors and money. I've had roommates who slacked on their rent, wouldn't work much and expected ME to pick up their slack of the rent.
People here are unmotivated and have an attitude of entitlement.. Sleezy, dirty bums everywhere--oh my gosh! Section 8 housing everywhere. Everytime I go to the store I see someone using foodstamps. This is not a career minded town. Phoenix is just a big worthless p*****g ground.
I live in Phoenix Arizona it's one of the safest city in Arizona
The crime was very low and my experience was very nice. The weather was hot. There were many fun things to do there. I went to a baseball game. It was a lot of fun.
the baseball game was fun and also the food in the area was amazing
Crime was usually seen at least every day, with shootings or gun violence at fast food restaurants at least once a month. A university began volunteering in the community and would clean the streets, offer services, etc. The roads are bumpy and old, and the drivers are seemingly unsafe and run red lights/cut people off all the time. There are homeless people on every corner and freeway enterence.
There is a Joyride Taco and Federal Pizza on central and camelback that has great food, and The Biltmore shopping area is a reasonably safe mall with lots of stores and places to eat.
The crime was average for a large city. There was always something to do. A variety of entertainment, excellent nightlife and plenty of good food.
Downtown Tempe was the favorite hangout with plenty of shops, entertainment, and a diverse culture. The downside of the Phoenix area was the oppressive heat and the polluted air.
Phoenix is one of the coolest places I've ever visited. There is so much cool stuff to do in the city and nearby.
There's a great mix of indoors and outdoors, with great life and attractions within the city of Phoenix and great wildlife areas nearby.
The crime is pretty normal for a city
The heat is unbearable in the Summer. It is nice in the Winter. People there are nice as well.
The crime rate is less than most places but it has its shares like any other place. The Schooling is poor, it seems like they don't care about who is learning, just about getting paid. Did I mention it's scalding hot here-
People are a lot friendlier here, compared to most cities, but the drug rate is crazy out of control. Like I stated the schooling is horrible and it's hard to find jobs.
What can I say about the state of Arizona besides if you are thinking about moving here for the lower cost of living don't. Arizona being a cheaper state to live in myth. From May till the middle of October it is 90 plus degrees all day and all night. It doesn't cool off till 3 am. All the money that you would save on rent is being spend on electric in the summer. On top of that think traffic is bad in LA- It's even worst in Phoenix. Why- Because despite the population being on the rise for years now nothing has been done to improve the roads and freeways. There are pot holes everywhere. Some of the roads need to be completely replaced. It is recommended all roads are replaced every 32 years. Arizona can't afford to keep their roads maintained. It's a joke lines are fading fast roads are falling apart yet nothing can be done. How about I don't know raising taxes on the wealthy or raising taxes in general to help fix the state you live in instead of letting it fall apart and have it look like trash. How about plan for the future and think about having more than one major freeway go east to west. It would help not have so many drivers in the city in the morning and afternoon which in turn help lower pedestrians getting killed walking across the street. It's a simple concept less drivers would be driving in the city because they would have the option of I don't know going on a freeway like any other major city. Have some sort of a plan. Planning to expand the 10 freeway is great. Taking 2 years to start construction is ridiculous. Not having a plan for another freeway is retarded. You know your popular is growing think about the future it's common sense. Update the speed limits an average of 40 MPH is a joke. It shouldn't take an average of 30 minutes to get anywhere.
How bad traffic is and how bad the weather is. It's an average of 90 degrees all d**n day from May till middle of October. Enjoy paying 309 dollar electric bills and being stuck inside and hating to go outside
Rankings & Articles For Phoenix


Locations Around Phoenix
Map Of Phoenix, AZ
Best Places Around Phoenix
Scottsdale, AZ
Population 243,821
Litchfield Park, AZ
Population 6,916
Peoria, AZ
Population 196,906
Tempe, AZ
Population 188,065
Paradise Valley, AZ
Population 12,611
Cave Creek, AZ
Population 5,091
Glendale, AZ
Population 252,833
El Mirage, AZ
Population 36,088
Guadalupe, AZ
Population 5,272
Tolleson, AZ
Population 7,668
Phoenix Demographics And Statistics
Population over time in Phoenix
The current population in Phoenix is 1,642,323. The population has increased 13.2% from 2010.
| Year | Population | % Change |
|---|---|---|
| 2024 | 1,642,323 | 1.1% |
| 2023 | 1,624,832 | 1.0% |
| 2022 | 1,609,456 | 1.2% |
| 2021 | 1,591,119 | -4.1% |
| 2020 | 1,658,422 | 1.6% |
| 2019 | 1,633,017 | 1.4% |
| 2018 | 1,610,071 | 2.3% |
| 2017 | 1,574,421 | 1.2% |
| 2016 | 1,555,324 | 2.7% |
| 2015 | 1,514,208 | 1.6% |
| 2014 | 1,490,758 | 1.2% |
| 2013 | 1,473,639 | 0.8% |
| 2012 | 1,462,368 | 0.5% |
| 2011 | 1,455,565 | 0.4% |
| 2010 | 1,450,206 | - |
Race / Ethnicity in Phoenix
See the full breakdown
Phoenix is:
40.6% White with 667,224 White residents.
7.4% African American with 121,686 African American residents.
1.4% American Indian with 23,063 American Indian residents.
4.0% Asian with 65,942 Asian residents.
0.2% Hawaiian with 2,855 Hawaiian residents.
0.4% Other with 7,332 Other residents.
4.0% Two Or More with 64,996 Two Or More residents.
42.0% Hispanic with 689,225 Hispanic residents.
| Race | Phoenix | AZ | USA |
|---|---|---|---|
| White | 40.6% | 52.6% | 57.4% |
| African American | 7.4% | 4.4% | 11.9% |
| American Indian | 1.4% | 3.2% | 0.5% |
| Asian | 4.0% | 3.5% | 5.9% |
| Hawaiian | 0.2% | 0.2% | 0.2% |
| Other | 0.4% | 0.5% | 0.6% |
| Two Or More | 4.0% | 4.4% | 4.3% |
| Hispanic | 42.0% | 31.4% | 19.3% |
Gender in Phoenix
See the full breakdown
Phoenix is 49.8% female with 818,229 female residents.
Phoenix is 50.2% male with 824,093 male residents.
| Gender | Phoenix | AZ | USA |
|---|---|---|---|
| Female | 49.8% | 50.1% | 50.5% |
| Male | 50.2% | 49.9% | 49.5% |
Highest level of educational attainment in Phoenix for adults over 25
See the full breakdown
7.0% of adults in Phoenix completed < 9th grade.
8.0% of adults in Phoenix completed 9-12th grade.
23.0% of adults in Phoenix completed high school / ged.
21.0% of adults in Phoenix completed some college.
8.0% of adults in Phoenix completed associate's degree.
21.0% of adults in Phoenix completed bachelor's degree.
9.0% of adults in Phoenix completed master's degree.
2.0% of adults in Phoenix completed professional degree.
1.0% of adults in Phoenix completed doctorate degree.
| Education | Phoenix | AZ | USA |
|---|---|---|---|
| < 9th Grade | 7.0% | 6.0% | 4.0% |
| 9-12th Grade | 8.0% | 6.0% | 6.0% |
| High School / GED | 23.0% | 23.0% | 26.0% |
| Some College | 21.0% | 23.0% | 19.0% |
| Associate's Degree | 8.0% | 9.0% | 9.0% |
| Bachelor's Degree | 21.0% | 20.0% | 22.0% |
| Master's Degree | 9.0% | 9.0% | 10.0% |
| Professional Degree | 2.0% | 2.0% | 2.0% |
| Doctorate Degree | 1.0% | 2.0% | 2.0% |
Household Income For Phoenix, Arizona
See the full breakdown
4.9% of households in Phoenix earn Less than $10,000.
2.7% of households in Phoenix earn $10,000 to $14,999.
5.1% of households in Phoenix earn $15,000 to $24,999.
6.2% of households in Phoenix earn $25,000 to $34,999.
10.9% of households in Phoenix earn $35,000 to $49,999.
16.7% of households in Phoenix earn $50,000 to $74,999.
13.5% of households in Phoenix earn $75,000 to $99,999.
18.4% of households in Phoenix earn $100,000 to $149,999.
9.3% of households in Phoenix earn $150,000 to $199,999.
12.4% of households in Phoenix earn $200,000 or more.
| Income | Phoenix | AZ | USA |
|---|---|---|---|
| Less than $10,000 | 4.9% | 5.0% | 5.0% |
| $10,000 to $14,999 | 2.7% | 2.7% | 3.4% |
| $15,000 to $24,999 | 5.1% | 5.8% | 6.3% |
| $25,000 to $34,999 | 6.2% | 6.6% | 6.6% |
| $35,000 to $49,999 | 10.9% | 10.5% | 10.1% |
| $50,000 to $74,999 | 16.7% | 16.5% | 15.5% |
| $75,000 to $99,999 | 13.5% | 13.5% | 12.6% |
| $100,000 to $149,999 | 18.4% | 18.4% | 17.5% |
| $150,000 to $199,999 | 9.3% | 9.4% | 9.6% |
| $200,000 or more | 12.4% | 11.6% | 13.4% |
Source: U.S. Census ACS 5-year estimates (2024)


