Peoria SnackAbility
Overall SnackAbility
Crime in Peoria summary. We use data from the FBI to determine the crime rates in Peoria. Key points include:
There were 2,935 total crimes in Peoria in the last reporting year.
The overall crime rate per 100,000 people in Peoria is 1,459.8 / 100k people.
The violent crime rate per 100,000 people in Peoria is 254.7 / 100k people.
The property crime rate per 100,000 people in Peoria is 1,205.1 / 100k people.
Overall, crime in Peoria is -31.12% below the national average.
Total Crimes
Below National Average
Crime In Peoria Comparison Table
| Statistic | Count Raw |
Peoria / 100k People |
Arizona / 100k People |
National / 100k People |
|---|---|---|---|---|
| Total Crimes Per 100K | 2,935 | 1,459.8 | 2,214.0 | 2,119.2 |
| Violent Crime | 512 | 254.7 | 421.9 | 359.0 |
| Murder | 3 | 1.5 | 4.9 | 5.0 |
| Robbery | 49 | 24.4 | 64.6 | 61.0 |
| Aggravated Assault | 373 | 185.5 | 312.4 | 256.0 |
| Property Crime | 2,423 | 1,205.1 | 1,792.1 | 1,760.0 |
| Burglary | 303 | 150.7 | 217.8 | 229.0 |
| Larceny | 1,823 | 906.7 | 1,329.9 | 1,272.0 |
| Car Theft | 297 | 147.7 | 244.4 | 259.0 |
Source: FBI Uniform Crime Reporting (2024)
Cost of living in Peoria summary. We use data on the cost of living to determine how expensive it is to live in Peoria. Real estate prices drive most of the variance in cost of living around Arizona. Key points include:
The cost of living in Peoria is 116 with 100 being average.
The cost of living in Peoria is 1.2x higher than the national average.
The median home value in Peoria is $488,595.
The median income in Peoria is $95,815.
Peoria's Overall Cost Of Living
Higher Than The National Average
Cost Of Living In Peoria Comparison Table
| Living Expense | Peoria | Arizona | National Average |
|---|---|---|---|
| Overall | 116 | 100 | 100 |
| Services | 101 | 99 | 100 |
| Groceries | 103 | 99 | 100 |
| Health | 152 | 97 | 100 |
| Housing | 107 | 104 | 100 |
| Transportation | 111 | 113 | 100 |
| Utilities | 106 | 104 | 100 |
Source: Cost of living index, normalized to US average = 100
Peoria, AZ Weather
The average high in Peoria is 85.8° and the average low is 58.1°.
There are 20.6 days of precipitation each year.
Expect an average of 9.3 inches of precipitation each year with 0.0 inches of snow.
| Stat | Peoria |
|---|---|
| Average Annual High | 85.8 |
| Average Annual Low | 58.1 |
| Annual Precipitation Days | 20.6 |
| Average Annual Precipitation | 9.3 |
| Average Annual Snowfall | 0.0 |
Average High
Days of Rain
Source: NOAA climate normals (30-year)
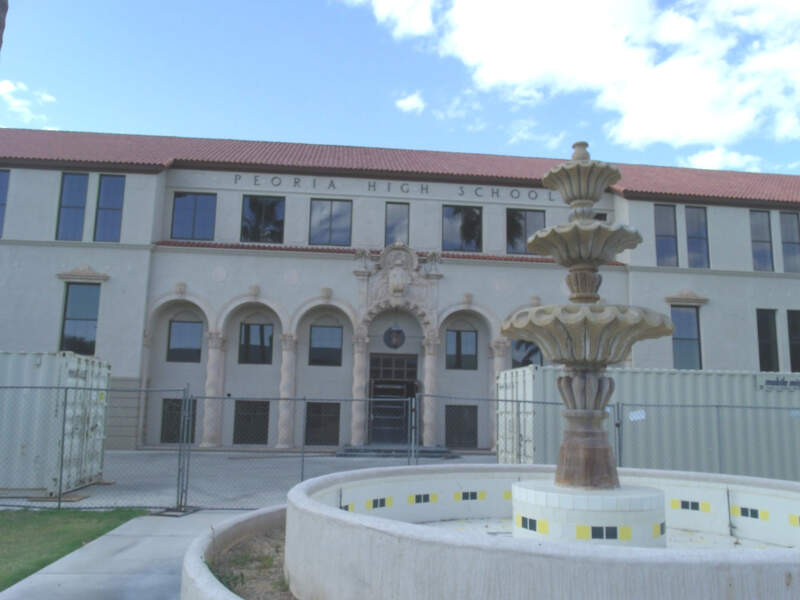
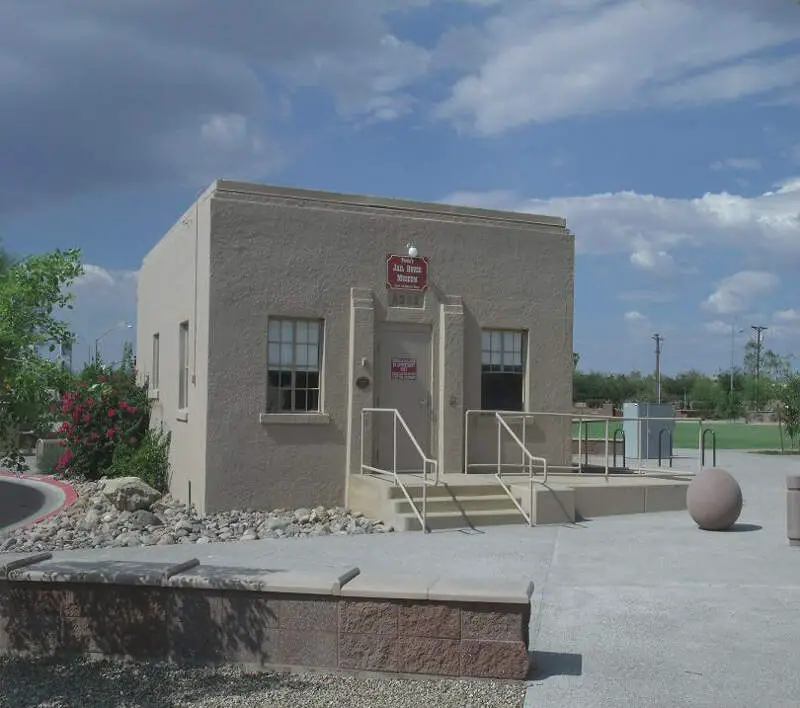
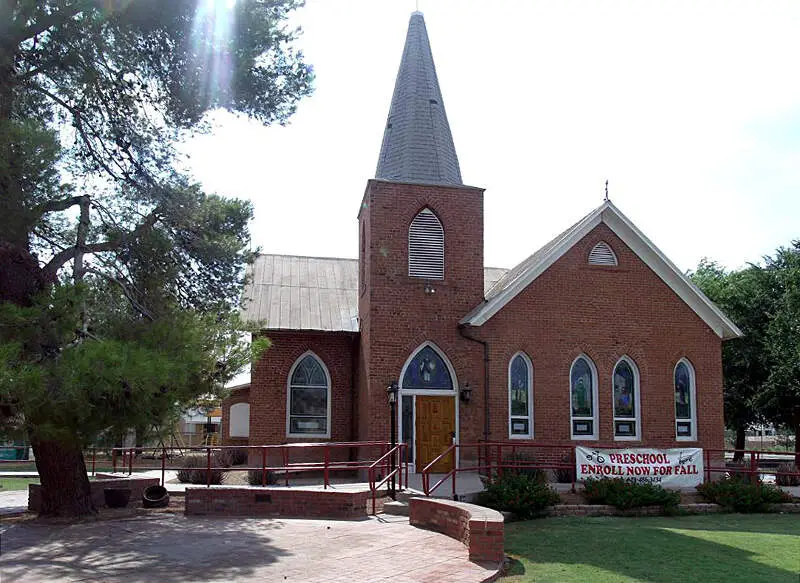
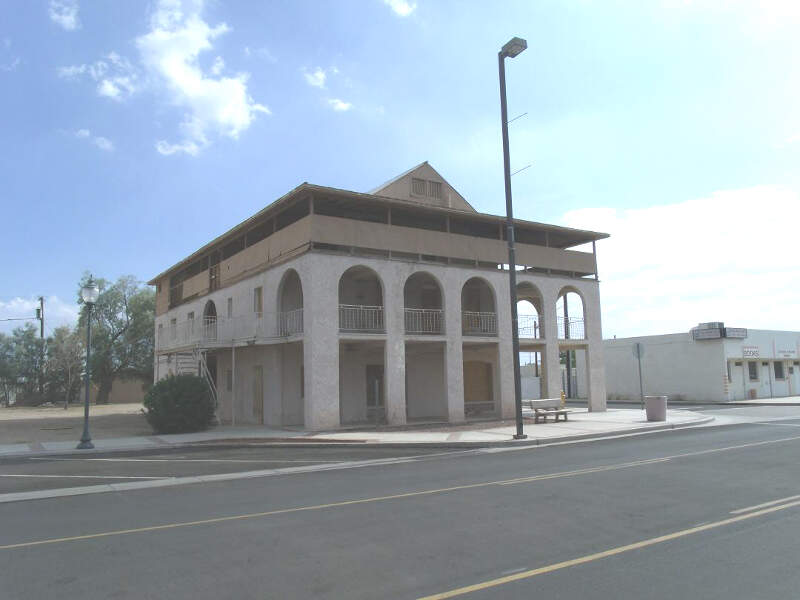
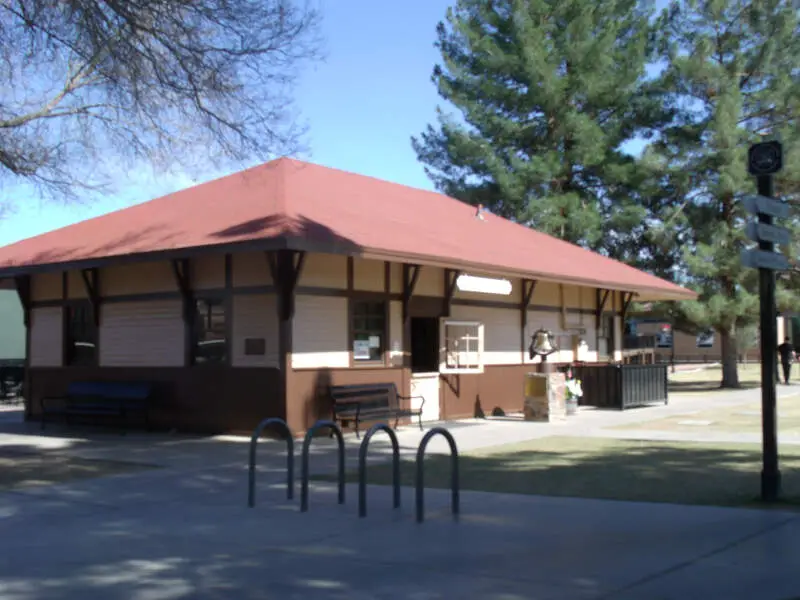
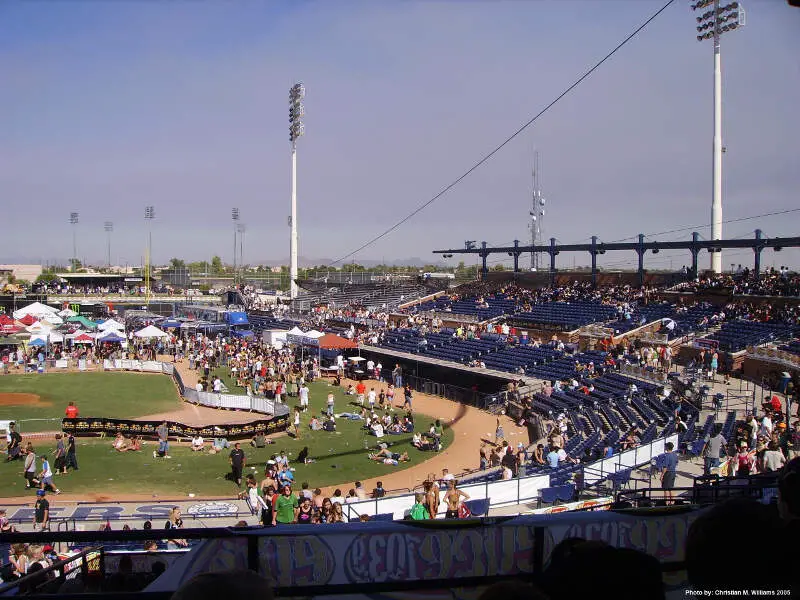
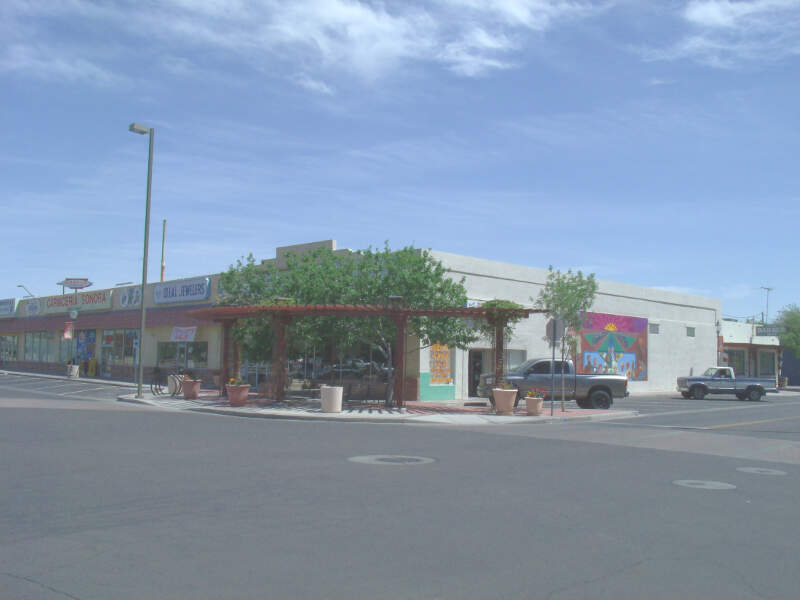
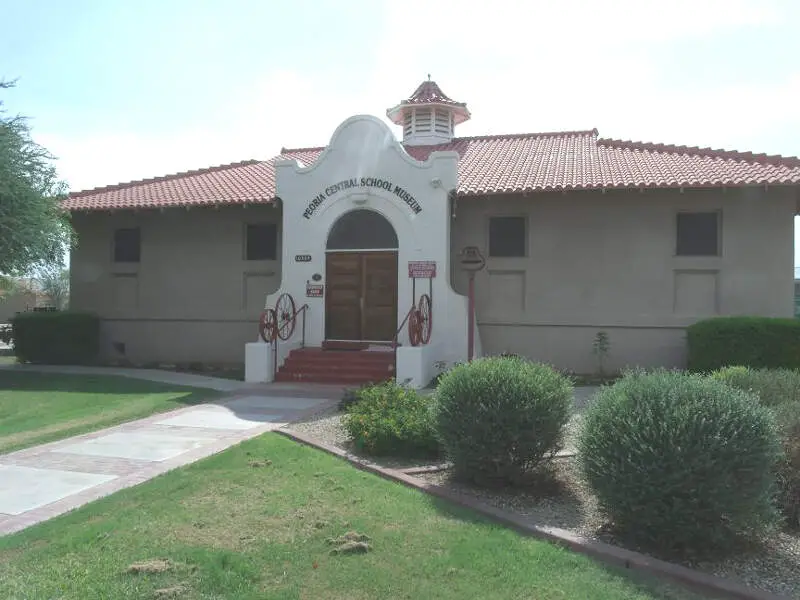
Peoria, AZ Photos
2 Reviews & Comments About Peoria

It was mainly suburban areas there so not much as far as crime, but being in the big city you always have the chance of something happening.
I really liked going to the outdoor malls and all the wonderful mexican food restaraunts. One restaraunt to look out for is Filibertos mexican food. The bad thing is that it is the suburbs so there isn't much to do as in activities.
The crime was very bad and I did not like it there
The schools were good
Rankings & Articles For Peoria


Locations Around Peoria
Map Of Peoria, AZ
Best Places Around Peoria
Litchfield Park, AZ
Population 6,916
New River, AZ
Population 18,240
Surprise, AZ
Population 154,948
Cave Creek, AZ
Population 5,091
Glendale, AZ
Population 252,833
Phoenix, AZ
Population 1,642,323
El Mirage, AZ
Population 36,088
Anthem, AZ
Population 22,584
Peoria Demographics And Statistics
Population over time in Peoria
The current population in Peoria is 196,906. The population has increased 32.4% from 2010.
| Year | Population | % Change |
|---|---|---|
| 2024 | 196,906 | 1.3% |
| 2023 | 194,338 | 1.6% |
| 2022 | 191,292 | 1.9% |
| 2021 | 187,733 | 9.1% |
| 2020 | 172,109 | 2.3% |
| 2019 | 168,196 | 2.2% |
| 2018 | 164,572 | 2.0% |
| 2017 | 161,383 | 1.7% |
| 2016 | 158,677 | -3.0% |
| 2015 | 163,664 | 2.1% |
| 2014 | 160,231 | 2.0% |
| 2013 | 157,152 | 1.7% |
| 2012 | 154,566 | 1.8% |
| 2011 | 151,770 | 2.1% |
| 2010 | 148,702 | - |
Race / Ethnicity in Peoria
See the full breakdown
Peoria is:
64.3% White with 126,555 White residents.
3.2% African American with 6,346 African American residents.
0.6% American Indian with 1,092 American Indian residents.
5.3% Asian with 10,401 Asian residents.
0.0% Hawaiian with 83 Hawaiian residents.
0.4% Other with 772 Other residents.
5.6% Two Or More with 10,939 Two Or More residents.
20.7% Hispanic with 40,718 Hispanic residents.
| Race | Peoria | AZ | USA |
|---|---|---|---|
| White | 64.3% | 52.6% | 57.4% |
| African American | 3.2% | 4.4% | 11.9% |
| American Indian | 0.6% | 3.2% | 0.5% |
| Asian | 5.3% | 3.5% | 5.9% |
| Hawaiian | 0.0% | 0.2% | 0.2% |
| Other | 0.4% | 0.5% | 0.6% |
| Two Or More | 5.6% | 4.4% | 4.3% |
| Hispanic | 20.7% | 31.4% | 19.3% |
Gender in Peoria
See the full breakdown
Peoria is 51.5% female with 101,443 female residents.
Peoria is 48.5% male with 95,462 male residents.
| Gender | Peoria | AZ | USA |
|---|---|---|---|
| Female | 51.5% | 50.1% | 50.5% |
| Male | 48.5% | 49.9% | 49.5% |
Highest level of educational attainment in Peoria for adults over 25
See the full breakdown
4.0% of adults in Peoria completed < 9th grade.
5.0% of adults in Peoria completed 9-12th grade.
22.0% of adults in Peoria completed high school / ged.
23.0% of adults in Peoria completed some college.
10.0% of adults in Peoria completed associate's degree.
22.0% of adults in Peoria completed bachelor's degree.
11.0% of adults in Peoria completed master's degree.
2.0% of adults in Peoria completed professional degree.
1.0% of adults in Peoria completed doctorate degree.
| Education | Peoria | AZ | USA |
|---|---|---|---|
| < 9th Grade | 4.0% | 6.0% | 4.0% |
| 9-12th Grade | 5.0% | 6.0% | 6.0% |
| High School / GED | 22.0% | 23.0% | 26.0% |
| Some College | 23.0% | 23.0% | 19.0% |
| Associate's Degree | 10.0% | 9.0% | 9.0% |
| Bachelor's Degree | 22.0% | 20.0% | 22.0% |
| Master's Degree | 11.0% | 9.0% | 10.0% |
| Professional Degree | 2.0% | 2.0% | 2.0% |
| Doctorate Degree | 1.0% | 2.0% | 2.0% |
Household Income For Peoria, Arizona
See the full breakdown
3.6% of households in Peoria earn Less than $10,000.
1.5% of households in Peoria earn $10,000 to $14,999.
4.6% of households in Peoria earn $15,000 to $24,999.
5.0% of households in Peoria earn $25,000 to $34,999.
8.5% of households in Peoria earn $35,000 to $49,999.
15.2% of households in Peoria earn $50,000 to $74,999.
13.9% of households in Peoria earn $75,000 to $99,999.
19.5% of households in Peoria earn $100,000 to $149,999.
12.3% of households in Peoria earn $150,000 to $199,999.
15.9% of households in Peoria earn $200,000 or more.
| Income | Peoria | AZ | USA |
|---|---|---|---|
| Less than $10,000 | 3.6% | 5.0% | 5.0% |
| $10,000 to $14,999 | 1.5% | 2.7% | 3.4% |
| $15,000 to $24,999 | 4.6% | 5.8% | 6.3% |
| $25,000 to $34,999 | 5.0% | 6.6% | 6.6% |
| $35,000 to $49,999 | 8.5% | 10.5% | 10.1% |
| $50,000 to $74,999 | 15.2% | 16.5% | 15.5% |
| $75,000 to $99,999 | 13.9% | 13.5% | 12.6% |
| $100,000 to $149,999 | 19.5% | 18.4% | 17.5% |
| $150,000 to $199,999 | 12.3% | 9.4% | 9.6% |
| $200,000 or more | 15.9% | 11.6% | 13.4% |
Source: U.S. Census ACS 5-year estimates (2024)


