Florence SnackAbility
Overall SnackAbility
Crime in Florence summary. We use data from the FBI to determine the crime rates in Florence. Key points include:
There were 156 total crimes in Florence in the last reporting year.
The overall crime rate per 100,000 people in Florence is 668.0 / 100k people.
The violent crime rate per 100,000 people in Florence is 119.9 / 100k people.
The property crime rate per 100,000 people in Florence is 548.1 / 100k people.
Overall, crime in Florence is -68.48% below the national average.
Total Crimes
Below National Average
Crime In Florence Comparison Table
| Statistic | Count Raw |
Florence / 100k People |
Arizona / 100k People |
National / 100k People |
|---|---|---|---|---|
| Total Crimes Per 100K | 156 | 668.0 | 2,214.0 | 2,119.2 |
| Violent Crime | 28 | 119.9 | 421.9 | 359.0 |
| Murder | 2 | 8.6 | 4.9 | 5.0 |
| Robbery | 1 | 4.3 | 64.6 | 61.0 |
| Aggravated Assault | 25 | 107.0 | 312.4 | 256.0 |
| Property Crime | 128 | 548.1 | 1,792.1 | 1,760.0 |
| Burglary | 14 | 59.9 | 217.8 | 229.0 |
| Larceny | 100 | 428.2 | 1,329.9 | 1,272.0 |
| Car Theft | 14 | 59.9 | 244.4 | 259.0 |
Source: FBI Uniform Crime Reporting (2024)
Cost of living in Florence summary. We use data on the cost of living to determine how expensive it is to live in Florence. Real estate prices drive most of the variance in cost of living around Arizona. Key points include:
The cost of living in Florence is 104 with 100 being average.
The cost of living in Florence is 1.0x higher than the national average.
The median home value in Florence is $333,592.
The median income in Florence is $79,644.
Florence's Overall Cost Of Living
Higher Than The National Average
Cost Of Living In Florence Comparison Table
| Living Expense | Florence | Arizona | National Average |
|---|---|---|---|
| Overall | 104 | 100 | 100 |
| Services | 103 | 99 | 100 |
| Groceries | 102 | 99 | 100 |
| Health | 101 | 97 | 100 |
| Housing | 102 | 104 | 100 |
| Transportation | 112 | 113 | 100 |
| Utilities | 106 | 104 | 100 |
Source: Cost of living index, normalized to US average = 100
Florence, AZ Weather
The average high in Florence is 85.1° and the average low is 55.8°.
There are 24.0 days of precipitation each year.
Expect an average of 10.6 inches of precipitation each year with 0.7 inches of snow.
| Stat | Florence |
|---|---|
| Average Annual High | 85.1 |
| Average Annual Low | 55.8 |
| Annual Precipitation Days | 24.0 |
| Average Annual Precipitation | 10.6 |
| Average Annual Snowfall | 0.7 |
Average High
Days of Rain
Source: NOAA climate normals (30-year)
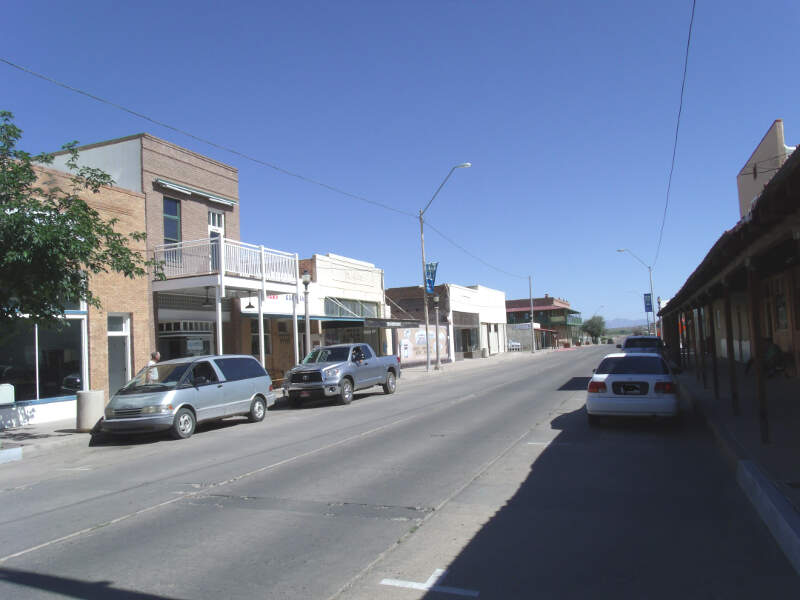
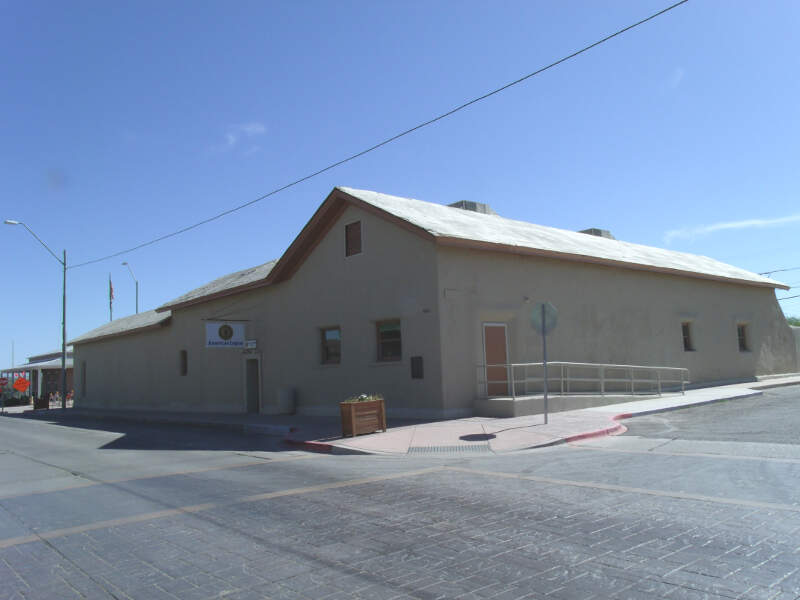
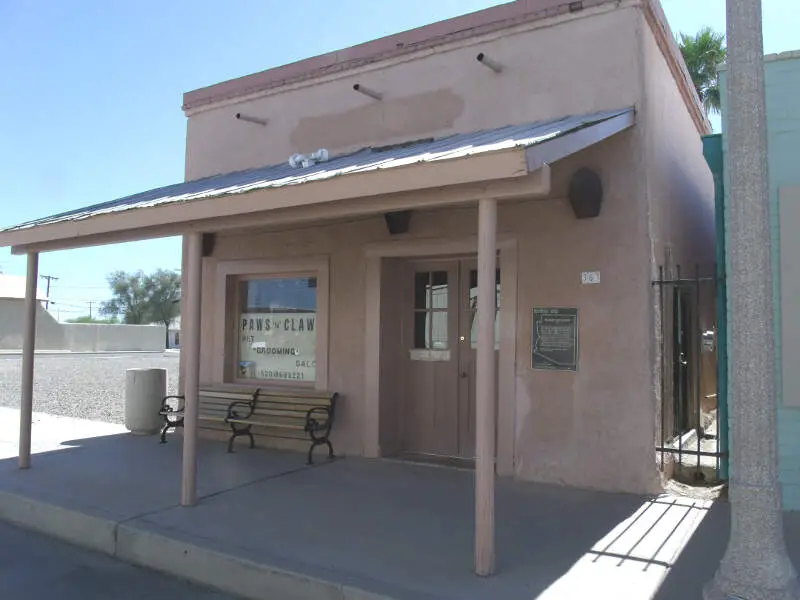
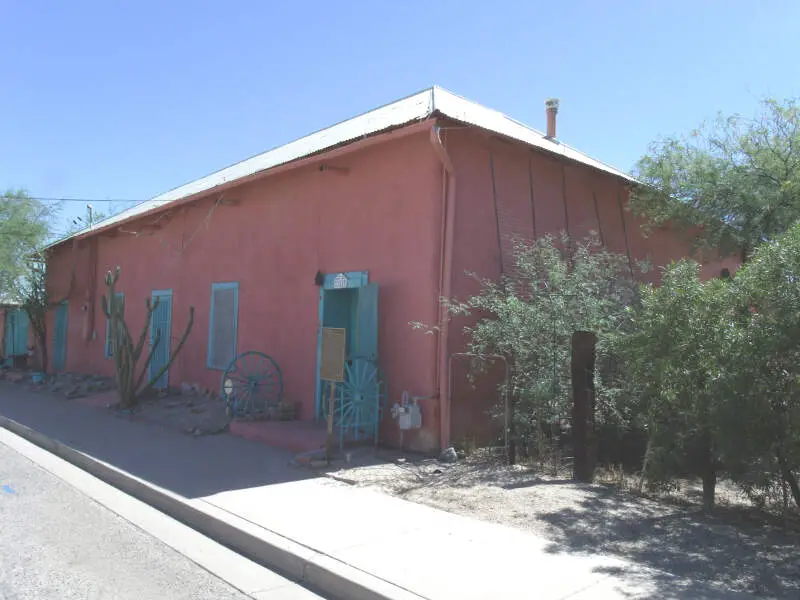
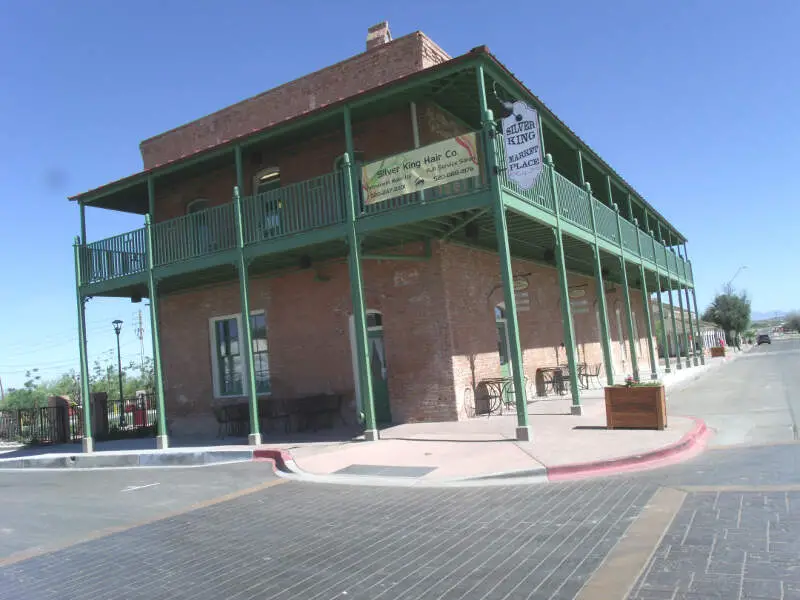
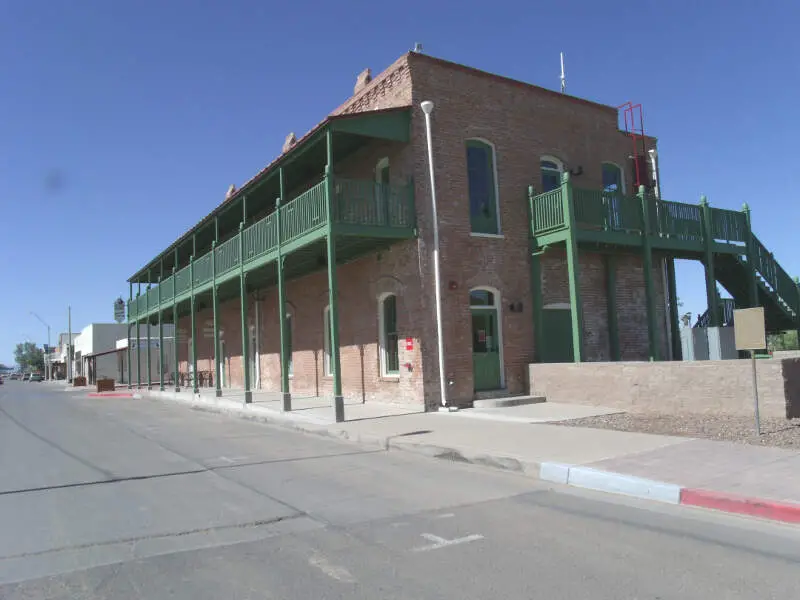
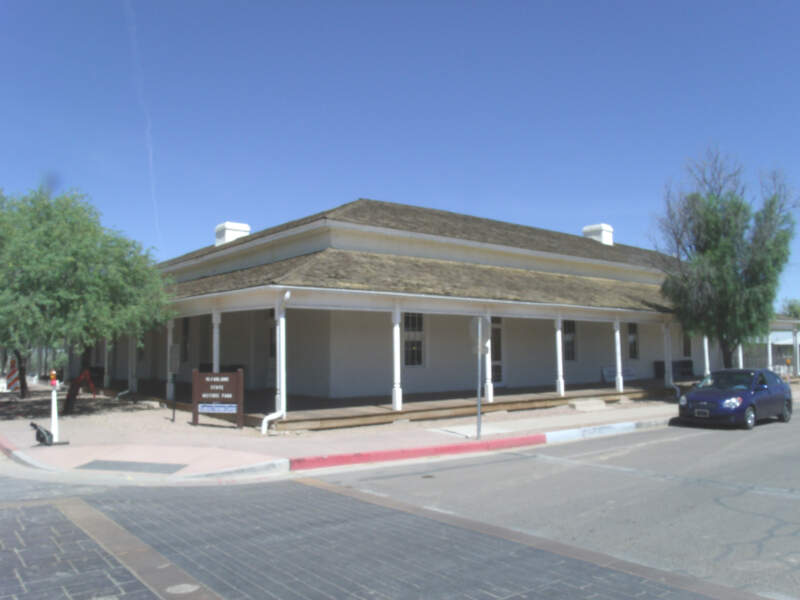
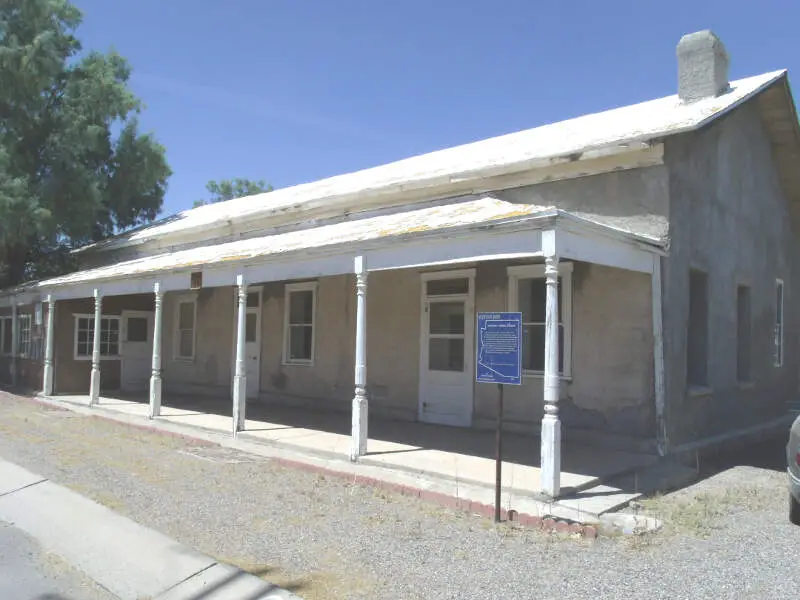
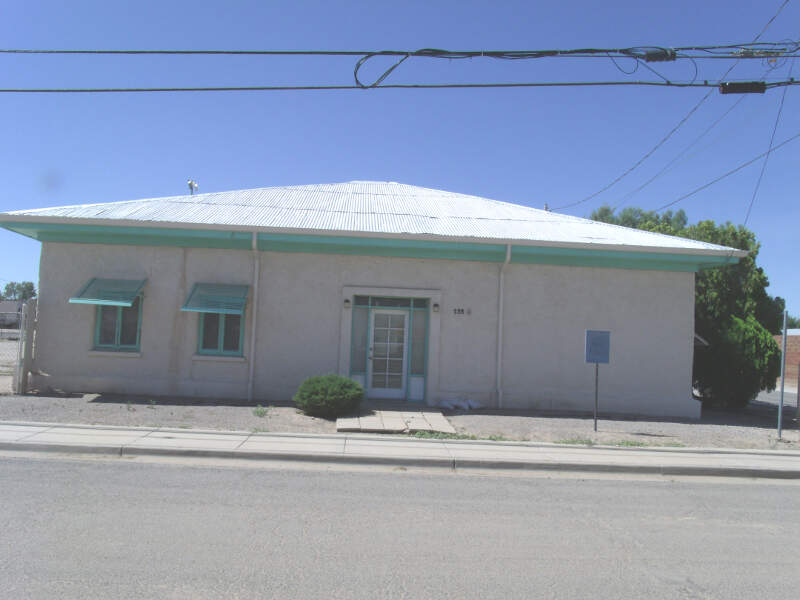
Florence, AZ Photos
Rankings & Articles For Florence


Locations Around Florence
Map Of Florence, AZ
Best Places Around Florence
Santa Cruz, CA
Population 61,607
Gilbert, AZ
Population 280,262
Fountain Hills, AZ
Population 23,789
Chandler, AZ
Population 280,136
Scottsdale, AZ
Population 243,821
Sun Lakes, AZ
Population 13,924
Marana, AZ
Population 56,938
Queen Creek, AZ
Population 71,867
Tempe, AZ
Population 188,065
Saddlebrooke, AZ
Population 13,085
Florence Demographics And Statistics
Population over time in Florence
The current population in Florence is 25,570. The population has increased 8.3% from 2010.
| Year | Population | % Change |
|---|---|---|
| 2024 | 25,570 | -1.5% |
| 2023 | 25,961 | 0.7% |
| 2022 | 25,783 | 1.7% |
| 2021 | 25,356 | -5.3% |
| 2020 | 26,777 | 1.4% |
| 2019 | 26,420 | 0.3% |
| 2018 | 26,350 | 1.1% |
| 2017 | 26,066 | -0.6% |
| 2016 | 26,221 | -14.8% |
| 2015 | 30,770 | 16.1% |
| 2014 | 26,513 | 1.6% |
| 2013 | 26,099 | 0.9% |
| 2012 | 25,866 | 5.3% |
| 2011 | 24,560 | 4.0% |
| 2010 | 23,616 | - |
Race / Ethnicity in Florence
See the full breakdown
Florence is:
56.4% White with 14,420 White residents.
8.2% African American with 2,096 African American residents.
2.3% American Indian with 588 American Indian residents.
0.5% Asian with 135 Asian residents.
0.3% Hawaiian with 65 Hawaiian residents.
0.1% Other with 22 Other residents.
0.8% Two Or More with 214 Two Or More residents.
31.4% Hispanic with 8,030 Hispanic residents.
| Race | Florence | AZ | USA |
|---|---|---|---|
| White | 56.4% | 52.6% | 57.4% |
| African American | 8.2% | 4.4% | 11.9% |
| American Indian | 2.3% | 3.2% | 0.5% |
| Asian | 0.5% | 3.5% | 5.9% |
| Hawaiian | 0.3% | 0.2% | 0.2% |
| Other | 0.1% | 0.5% | 0.6% |
| Two Or More | 0.8% | 4.4% | 4.3% |
| Hispanic | 31.4% | 31.4% | 19.3% |
Gender in Florence
See the full breakdown
Florence is 31.6% female with 8,077 female residents.
Florence is 68.4% male with 17,492 male residents.
| Gender | Florence | AZ | USA |
|---|---|---|---|
| Female | 31.6% | 50.1% | 50.5% |
| Male | 68.4% | 49.9% | 49.5% |
Highest level of educational attainment in Florence for adults over 25
See the full breakdown
6.0% of adults in Florence completed < 9th grade.
10.0% of adults in Florence completed 9-12th grade.
33.0% of adults in Florence completed high school / ged.
26.0% of adults in Florence completed some college.
8.0% of adults in Florence completed associate's degree.
13.0% of adults in Florence completed bachelor's degree.
4.0% of adults in Florence completed master's degree.
0.0% of adults in Florence completed professional degree.
0.0% of adults in Florence completed doctorate degree.
| Education | Florence | AZ | USA |
|---|---|---|---|
| < 9th Grade | 6.0% | 6.0% | 4.0% |
| 9-12th Grade | 10.0% | 6.0% | 6.0% |
| High School / GED | 33.0% | 23.0% | 26.0% |
| Some College | 26.0% | 23.0% | 19.0% |
| Associate's Degree | 8.0% | 9.0% | 9.0% |
| Bachelor's Degree | 13.0% | 20.0% | 22.0% |
| Master's Degree | 4.0% | 9.0% | 10.0% |
| Professional Degree | 0.0% | 2.0% | 2.0% |
| Doctorate Degree | 0.0% | 2.0% | 2.0% |
Household Income For Florence, Arizona
See the full breakdown
7.6% of households in Florence earn Less than $10,000.
1.4% of households in Florence earn $10,000 to $14,999.
5.7% of households in Florence earn $15,000 to $24,999.
1.6% of households in Florence earn $25,000 to $34,999.
12.3% of households in Florence earn $35,000 to $49,999.
15.9% of households in Florence earn $50,000 to $74,999.
13.2% of households in Florence earn $75,000 to $99,999.
23.4% of households in Florence earn $100,000 to $149,999.
9.6% of households in Florence earn $150,000 to $199,999.
9.3% of households in Florence earn $200,000 or more.
| Income | Florence | AZ | USA |
|---|---|---|---|
| Less than $10,000 | 7.6% | 5.0% | 5.0% |
| $10,000 to $14,999 | 1.4% | 2.7% | 3.4% |
| $15,000 to $24,999 | 5.7% | 5.8% | 6.3% |
| $25,000 to $34,999 | 1.6% | 6.6% | 6.6% |
| $35,000 to $49,999 | 12.3% | 10.5% | 10.1% |
| $50,000 to $74,999 | 15.9% | 16.5% | 15.5% |
| $75,000 to $99,999 | 13.2% | 13.5% | 12.6% |
| $100,000 to $149,999 | 23.4% | 18.4% | 17.5% |
| $150,000 to $199,999 | 9.6% | 9.4% | 9.6% |
| $200,000 or more | 9.3% | 11.6% | 13.4% |
Source: U.S. Census ACS 5-year estimates (2024)


