Queen Creek SnackAbility
Overall SnackAbility
Cost of living in Queen Creek summary. We use data on the cost of living to determine how expensive it is to live in Queen Creek. Real estate prices drive most of the variance in cost of living around Arizona. Key points include:
The cost of living in Queen Creek is 132 with 100 being average.
The cost of living in Queen Creek is 1.3x higher than the national average.
The median home value in Queen Creek is $632,223.
The median income in Queen Creek is $141,978.
Queen Creek's Overall Cost Of Living
Higher Than The National Average
Cost Of Living In Queen Creek Comparison Table
| Living Expense | Queen Creek | Arizona | National Average |
|---|---|---|---|
| Overall | 132 | 100 | 100 |
| Services | 99 | 99 | 100 |
| Groceries | 104 | 99 | 100 |
| Health | 193 | 97 | 100 |
| Housing | 106 | 104 | 100 |
| Transportation | 113 | 113 | 100 |
| Utilities | 103 | 104 | 100 |
Source: Cost of living index, normalized to US average = 100
Queen Creek, AZ Weather
The average high in Queen Creek is 85.8° and the average low is 58.1°.
There are 20.6 days of precipitation each year.
Expect an average of 9.3 inches of precipitation each year with 0.0 inches of snow.
| Stat | Queen Creek |
|---|---|
| Average Annual High | 85.8 |
| Average Annual Low | 58.1 |
| Annual Precipitation Days | 20.6 |
| Average Annual Precipitation | 9.3 |
| Average Annual Snowfall | 0.0 |
Average High
Days of Rain
Source: NOAA climate normals (30-year)
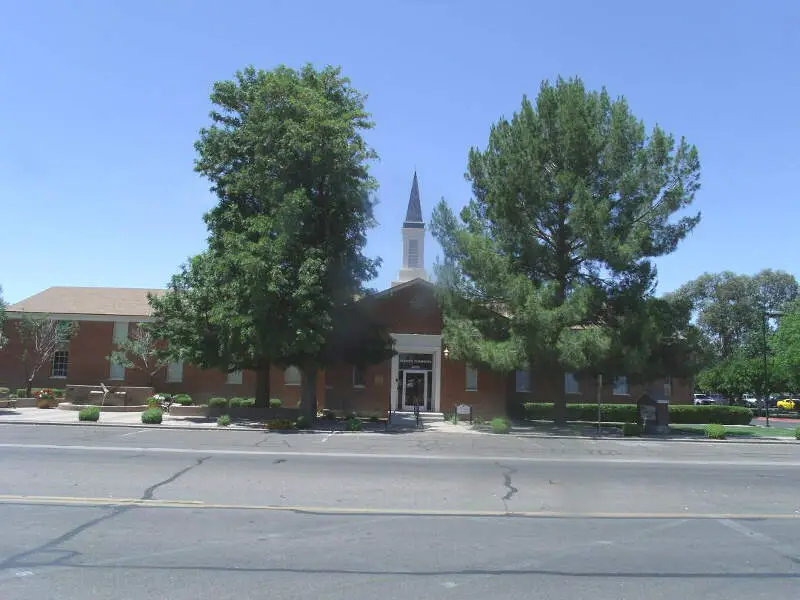
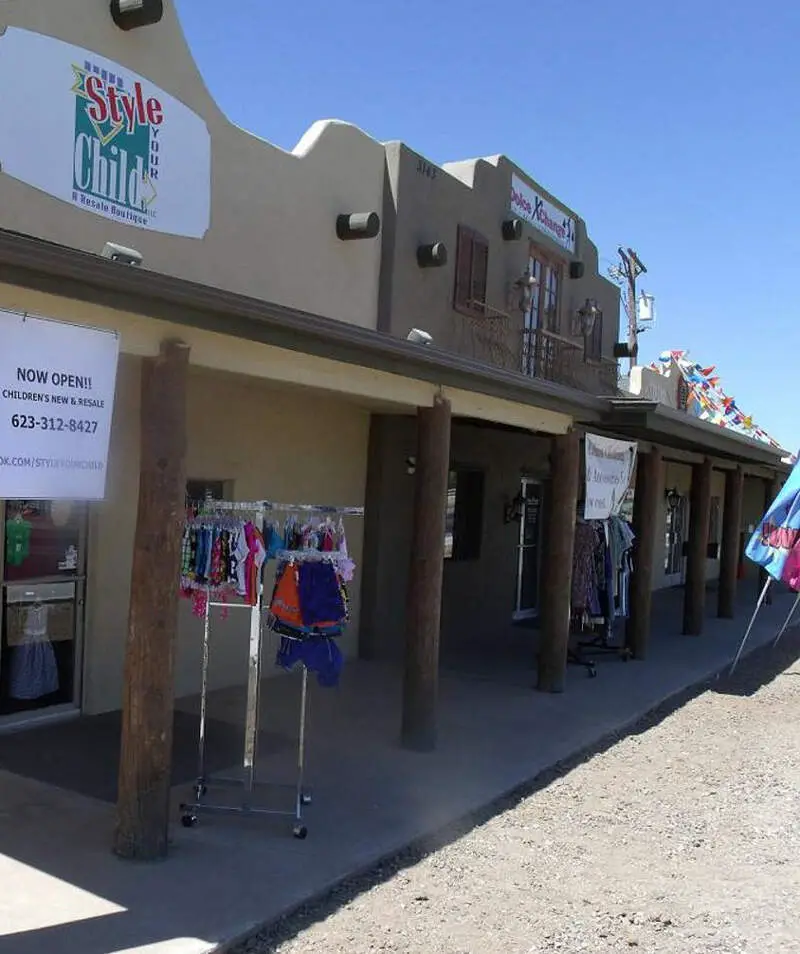
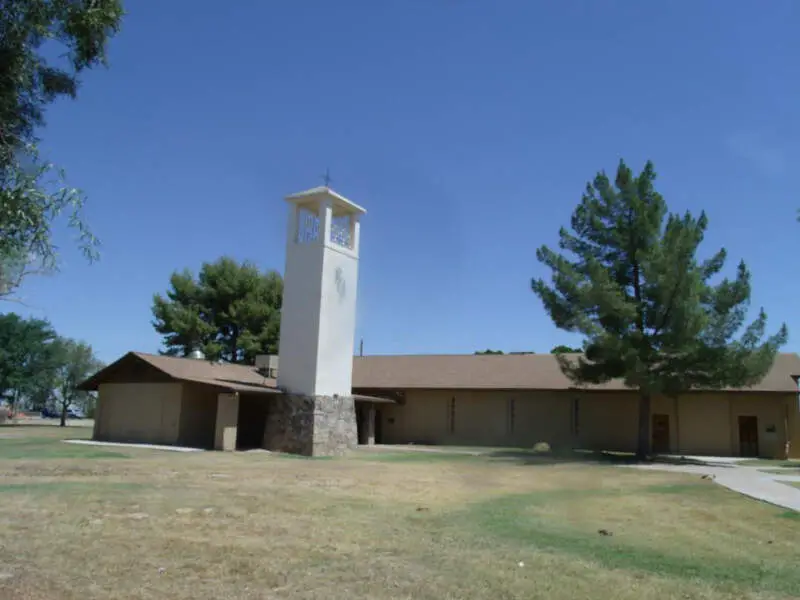
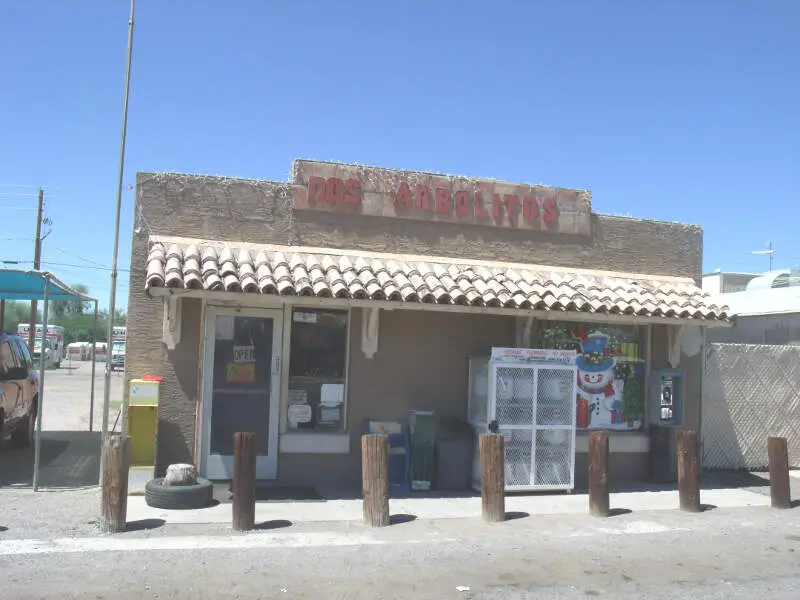
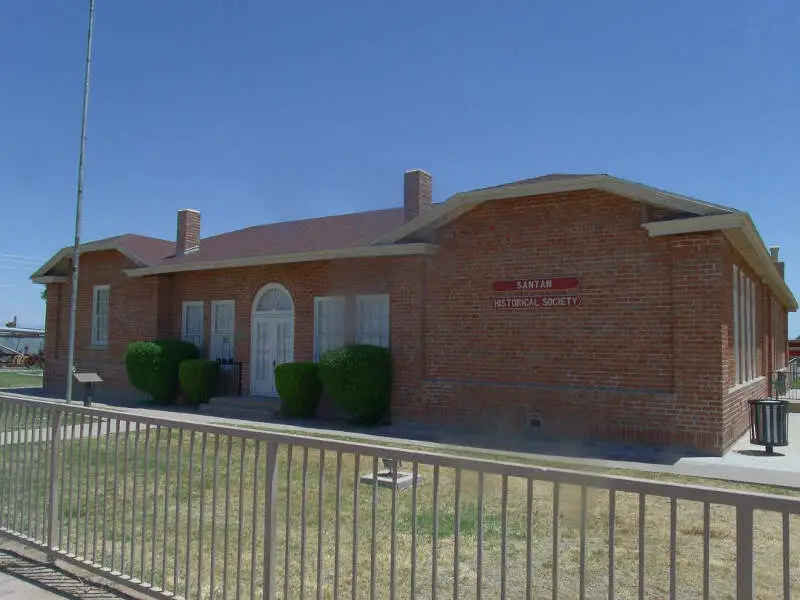
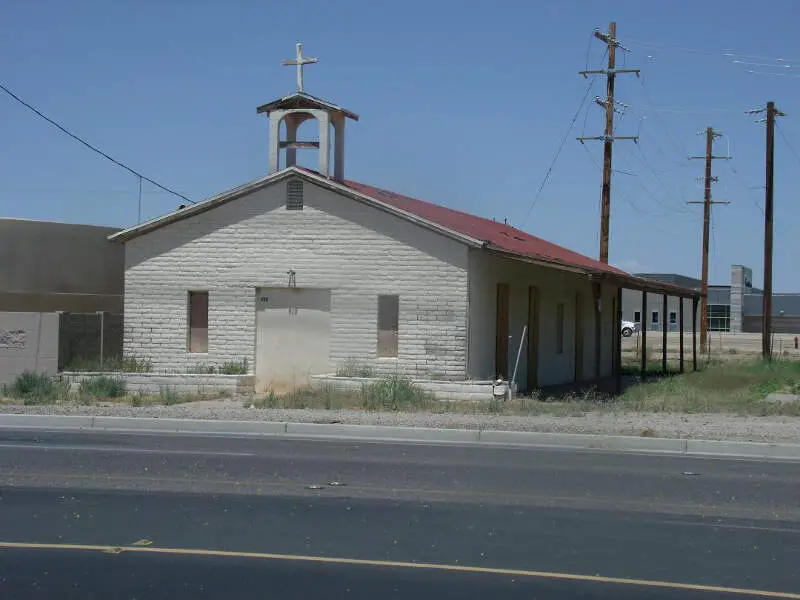
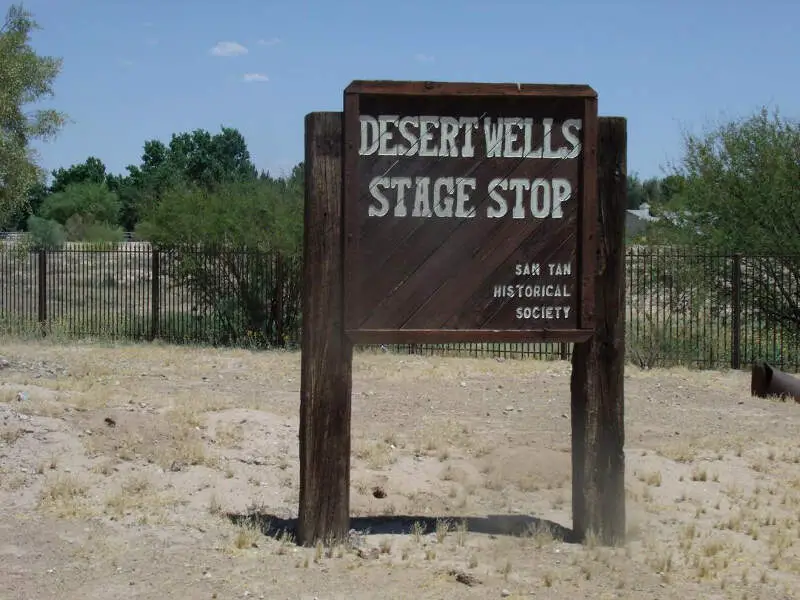
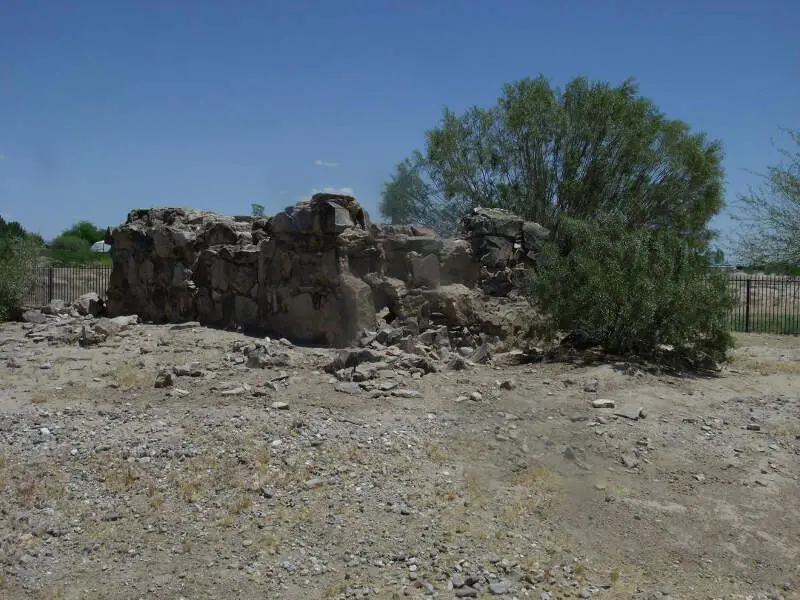
Queen Creek, AZ Photos

1 Reviews & Comments About Queen Creek

Very low crime rate; neighborhoods are all tree lined; and there are lots of cafes and shopping.
The movie theater is my favorite place. You don't have to fight for a seat. However, the traffic is horrible. You can't get anywhere quickly. It takes along time to get anywhere. Theres street lights at every quarter mile I think
Rankings & Articles For Queen Creek


Locations Around Queen Creek
Map Of Queen Creek, AZ
Best Places Around Queen Creek
Gilbert, AZ
Population 280,262
Chandler, AZ
Population 280,136
Sun Lakes, AZ
Population 13,924
Tempe, AZ
Population 188,065
Gold Canyon, AZ
Population 13,107
Mesa, AZ
Population 511,764
San Tan Valley, AZ
Population 109,189
Goodyear, AZ
Population 107,645
Florence, AZ
Population 25,570
Apache Junction, AZ
Population 41,058
Queen Creek Demographics And Statistics
Population over time in Queen Creek
The current population in Queen Creek is 71,867. The population has increased 211.7% from 2010.
| Year | Population | % Change |
|---|---|---|
| 2024 | 71,867 | 8.3% |
| 2023 | 66,369 | 7.4% |
| 2022 | 61,788 | 7.0% |
| 2021 | 57,728 | 10.7% |
| 2020 | 52,162 | 20.9% |
| 2019 | 43,129 | 19.6% |
| 2018 | 36,053 | 8.3% |
| 2017 | 33,298 | 7.9% |
| 2016 | 30,849 | 2.3% |
| 2015 | 30,143 | 5.7% |
| 2014 | 28,529 | 5.2% |
| 2013 | 27,120 | 4.9% |
| 2012 | 25,849 | 6.8% |
| 2011 | 24,207 | 5.0% |
| 2010 | 23,055 | - |
Race / Ethnicity in Queen Creek
See the full breakdown
Queen Creek is:
71.4% White with 51,319 White residents.
3.0% African American with 2,122 African American residents.
0.3% American Indian with 214 American Indian residents.
2.8% Asian with 1,984 Asian residents.
0.5% Hawaiian with 325 Hawaiian residents.
0.4% Other with 273 Other residents.
5.1% Two Or More with 3,637 Two Or More residents.
16.7% Hispanic with 11,993 Hispanic residents.
| Race | Queen Creek | AZ | USA |
|---|---|---|---|
| White | 71.4% | 52.6% | 57.4% |
| African American | 3.0% | 4.4% | 11.9% |
| American Indian | 0.3% | 3.2% | 0.5% |
| Asian | 2.8% | 3.5% | 5.9% |
| Hawaiian | 0.5% | 0.2% | 0.2% |
| Other | 0.4% | 0.5% | 0.6% |
| Two Or More | 5.1% | 4.4% | 4.3% |
| Hispanic | 16.7% | 31.4% | 19.3% |
Gender in Queen Creek
See the full breakdown
Queen Creek is 50.3% female with 36,156 female residents.
Queen Creek is 49.7% male with 35,711 male residents.
| Gender | Queen Creek | AZ | USA |
|---|---|---|---|
| Female | 50.3% | 50.1% | 50.5% |
| Male | 49.7% | 49.9% | 49.5% |
Highest level of educational attainment in Queen Creek for adults over 25
See the full breakdown
1.0% of adults in Queen Creek completed < 9th grade.
2.0% of adults in Queen Creek completed 9-12th grade.
19.0% of adults in Queen Creek completed high school / ged.
23.0% of adults in Queen Creek completed some college.
10.0% of adults in Queen Creek completed associate's degree.
29.0% of adults in Queen Creek completed bachelor's degree.
11.0% of adults in Queen Creek completed master's degree.
3.0% of adults in Queen Creek completed professional degree.
2.0% of adults in Queen Creek completed doctorate degree.
| Education | Queen Creek | AZ | USA |
|---|---|---|---|
| < 9th Grade | 1.0% | 6.0% | 4.0% |
| 9-12th Grade | 2.0% | 6.0% | 6.0% |
| High School / GED | 19.0% | 23.0% | 26.0% |
| Some College | 23.0% | 23.0% | 19.0% |
| Associate's Degree | 10.0% | 9.0% | 9.0% |
| Bachelor's Degree | 29.0% | 20.0% | 22.0% |
| Master's Degree | 11.0% | 9.0% | 10.0% |
| Professional Degree | 3.0% | 2.0% | 2.0% |
| Doctorate Degree | 2.0% | 2.0% | 2.0% |
Household Income For Queen Creek, Arizona
See the full breakdown
2.1% of households in Queen Creek earn Less than $10,000.
1.2% of households in Queen Creek earn $10,000 to $14,999.
1.6% of households in Queen Creek earn $15,000 to $24,999.
1.9% of households in Queen Creek earn $25,000 to $34,999.
3.3% of households in Queen Creek earn $35,000 to $49,999.
8.6% of households in Queen Creek earn $50,000 to $74,999.
10.8% of households in Queen Creek earn $75,000 to $99,999.
23.7% of households in Queen Creek earn $100,000 to $149,999.
19.2% of households in Queen Creek earn $150,000 to $199,999.
27.6% of households in Queen Creek earn $200,000 or more.
| Income | Queen Creek | AZ | USA |
|---|---|---|---|
| Less than $10,000 | 2.1% | 5.0% | 5.0% |
| $10,000 to $14,999 | 1.2% | 2.7% | 3.4% |
| $15,000 to $24,999 | 1.6% | 5.8% | 6.3% |
| $25,000 to $34,999 | 1.9% | 6.6% | 6.6% |
| $35,000 to $49,999 | 3.3% | 10.5% | 10.1% |
| $50,000 to $74,999 | 8.6% | 16.5% | 15.5% |
| $75,000 to $99,999 | 10.8% | 13.5% | 12.6% |
| $100,000 to $149,999 | 23.7% | 18.4% | 17.5% |
| $150,000 to $199,999 | 19.2% | 9.4% | 9.6% |
| $200,000 or more | 27.6% | 11.6% | 13.4% |
Source: U.S. Census ACS 5-year estimates (2024)


