Compare Tempe to…
Tempe SnackAbility
Overall SnackAbility
Crime in Tempe summary. We use data from the FBI to determine the crime rates in Tempe. Key points include:
There were 6,438 total crimes in Tempe in the last reporting year.
The overall crime rate per 100,000 people in Tempe is 3,364.1 / 100k people.
The violent crime rate per 100,000 people in Tempe is 470.3 / 100k people.
The property crime rate per 100,000 people in Tempe is 2,893.8 / 100k people.
Overall, crime in Tempe is 58.74% above the national average.
Total Crimes
Above National Average
Crime In Tempe Comparison Table
| Statistic | Count Raw |
Tempe / 100k People |
Arizona / 100k People |
National / 100k People |
|---|---|---|---|---|
| Total Crimes Per 100K | 6,438 | 3,364.1 | 2,214.0 | 2,119.2 |
| Violent Crime | 900 | 470.3 | 421.9 | 359.0 |
| Murder | 5 | 2.6 | 4.9 | 5.0 |
| Robbery | 127 | 66.4 | 64.6 | 61.0 |
| Aggravated Assault | 631 | 329.7 | 312.4 | 256.0 |
| Property Crime | 5,538 | 2,893.8 | 1,792.1 | 1,760.0 |
| Burglary | 640 | 334.4 | 217.8 | 229.0 |
| Larceny | 4,321 | 2,257.9 | 1,329.9 | 1,272.0 |
| Car Theft | 577 | 301.5 | 244.4 | 259.0 |
Source: FBI Uniform Crime Reporting (2024)
Cost of living in Tempe summary. We use data on the cost of living to determine how expensive it is to live in Tempe. Real estate prices drive most of the variance in cost of living around Arizona. Key points include:
The cost of living in Tempe is 117 with 100 being average.
The cost of living in Tempe is 1.2x higher than the national average.
The median home value in Tempe is $468,281.
The median income in Tempe is $79,663.
Tempe's Overall Cost Of Living
Higher Than The National Average
Cost Of Living In Tempe Comparison Table
| Living Expense | Tempe | Arizona | National Average |
|---|---|---|---|
| Overall | 117 | 100 | 100 |
| Services | 102 | 99 | 100 |
| Groceries | 100 | 99 | 100 |
| Health | 149 | 97 | 100 |
| Housing | 103 | 104 | 100 |
| Transportation | 108 | 113 | 100 |
| Utilities | 107 | 104 | 100 |
Source: Cost of living index, normalized to US average = 100
Tempe, AZ Weather
The average high in Tempe is 85.8° and the average low is 58.1°.
There are 20.6 days of precipitation each year.
Expect an average of 9.3 inches of precipitation each year with 0.0 inches of snow.
| Stat | Tempe |
|---|---|
| Average Annual High | 85.8 |
| Average Annual Low | 58.1 |
| Annual Precipitation Days | 20.6 |
| Average Annual Precipitation | 9.3 |
| Average Annual Snowfall | 0.0 |
Average High
Days of Rain
Source: NOAA climate normals (30-year)
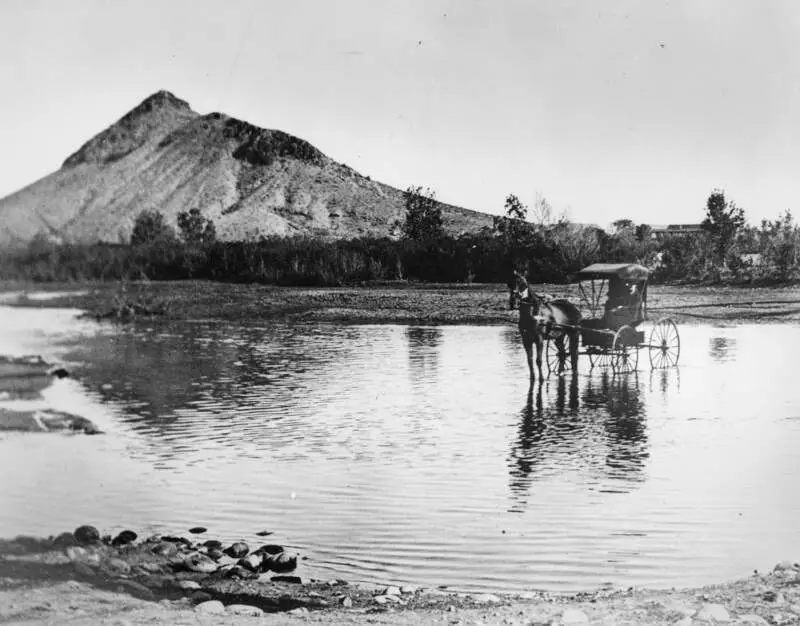
Tempe, AZ Photos


3 Reviews & Comments About Tempe

I love the night life. There are plenty of bars and night clubs are plentiful.
There is also a few fishing spots I love to cast at.
The college students. There is the Arizona State University in down town.
I like Tempe because it's where I grew up. It's pretty central to a lot of places. The Phoenix Zoo and Downtown Phoenix are very close to Tempe as well. Tempe is home to Arizona State University too. There are lots of neighborhood parks and activities that happen year round in Downtown Tempe.
Favorite places are Tempe Town Lake. The neighborhoods in South Tempe are really nice. Some bad things are that so many people are moving here and there is a lot of development which is good for a city's growth but it has taken away the small town feel that we had here when I was kid.
There was alot to do here in Tempe. Parks the YMCA and amusement parks nearby. It's a nice beautiful fun city. There are alot of stores nearby and places to go shopping. It's hard to get bored because there is so much to do.
Castles and coasters is a great amusement park to go to. Everything is close by. People are very friendly. There is also beautiful scenery.
Rankings & Articles For Tempe


Locations Around Tempe
Map Of Tempe, AZ
Best Places Around Tempe
Santa Cruz, CA
Population 61,607
Gilbert, AZ
Population 280,262
Fountain Hills, AZ
Population 23,789
Chandler, AZ
Population 280,136
Sun Lakes, AZ
Population 13,924
Queen Creek, AZ
Population 71,867
Paradise Valley, AZ
Population 12,611
Mesa, AZ
Population 511,764
Glendale, AZ
Population 252,833
Goodyear, AZ
Population 107,645
Tempe Demographics And Statistics
Population over time in Tempe
The current population in Tempe is 188,065. The population has increased 14.6% from 2010.
| Year | Population | % Change |
|---|---|---|
| 2024 | 188,065 | 0.9% |
| 2023 | 186,419 | 3.0% |
| 2022 | 181,005 | 1.2% |
| 2021 | 178,862 | -6.7% |
| 2020 | 191,607 | 2.2% |
| 2019 | 187,454 | 2.1% |
| 2018 | 183,652 | 3.0% |
| 2017 | 178,339 | 2.1% |
| 2016 | 174,708 | 2.9% |
| 2015 | 169,816 | 1.7% |
| 2014 | 166,975 | 1.4% |
| 2013 | 164,742 | 0.4% |
| 2012 | 164,139 | 0.1% |
| 2011 | 163,928 | -0.1% |
| 2010 | 164,147 | - |
Race / Ethnicity in Tempe
See the full breakdown
Tempe is:
51.0% White with 95,925 White residents.
6.9% African American with 12,910 African American residents.
1.8% American Indian with 3,384 American Indian residents.
9.7% Asian with 18,166 Asian residents.
0.5% Hawaiian with 959 Hawaiian residents.
0.8% Other with 1,437 Other residents.
6.3% Two Or More with 11,770 Two Or More residents.
23.1% Hispanic with 43,514 Hispanic residents.
| Race | Tempe | AZ | USA |
|---|---|---|---|
| White | 51.0% | 52.6% | 57.4% |
| African American | 6.9% | 4.4% | 11.9% |
| American Indian | 1.8% | 3.2% | 0.5% |
| Asian | 9.7% | 3.5% | 5.9% |
| Hawaiian | 0.5% | 0.2% | 0.2% |
| Other | 0.8% | 0.5% | 0.6% |
| Two Or More | 6.3% | 4.4% | 4.3% |
| Hispanic | 23.1% | 31.4% | 19.3% |
Gender in Tempe
See the full breakdown
Tempe is 47.2% female with 88,859 female residents.
Tempe is 52.8% male with 99,205 male residents.
| Gender | Tempe | AZ | USA |
|---|---|---|---|
| Female | 47.2% | 50.1% | 50.5% |
| Male | 52.8% | 49.9% | 49.5% |
Highest level of educational attainment in Tempe for adults over 25
See the full breakdown
2.0% of adults in Tempe completed < 9th grade.
3.0% of adults in Tempe completed 9-12th grade.
17.0% of adults in Tempe completed high school / ged.
20.0% of adults in Tempe completed some college.
8.0% of adults in Tempe completed associate's degree.
29.0% of adults in Tempe completed bachelor's degree.
14.0% of adults in Tempe completed master's degree.
3.0% of adults in Tempe completed professional degree.
4.0% of adults in Tempe completed doctorate degree.
| Education | Tempe | AZ | USA |
|---|---|---|---|
| < 9th Grade | 2.0% | 6.0% | 4.0% |
| 9-12th Grade | 3.0% | 6.0% | 6.0% |
| High School / GED | 17.0% | 23.0% | 26.0% |
| Some College | 20.0% | 23.0% | 19.0% |
| Associate's Degree | 8.0% | 9.0% | 9.0% |
| Bachelor's Degree | 29.0% | 20.0% | 22.0% |
| Master's Degree | 14.0% | 9.0% | 10.0% |
| Professional Degree | 3.0% | 2.0% | 2.0% |
| Doctorate Degree | 4.0% | 2.0% | 2.0% |
Household Income For Tempe, Arizona
See the full breakdown
6.6% of households in Tempe earn Less than $10,000.
2.5% of households in Tempe earn $10,000 to $14,999.
4.3% of households in Tempe earn $15,000 to $24,999.
5.5% of households in Tempe earn $25,000 to $34,999.
10.5% of households in Tempe earn $35,000 to $49,999.
17.5% of households in Tempe earn $50,000 to $74,999.
13.1% of households in Tempe earn $75,000 to $99,999.
19.9% of households in Tempe earn $100,000 to $149,999.
9.3% of households in Tempe earn $150,000 to $199,999.
10.8% of households in Tempe earn $200,000 or more.
| Income | Tempe | AZ | USA |
|---|---|---|---|
| Less than $10,000 | 6.6% | 5.0% | 5.0% |
| $10,000 to $14,999 | 2.5% | 2.7% | 3.4% |
| $15,000 to $24,999 | 4.3% | 5.8% | 6.3% |
| $25,000 to $34,999 | 5.5% | 6.6% | 6.6% |
| $35,000 to $49,999 | 10.5% | 10.5% | 10.1% |
| $50,000 to $74,999 | 17.5% | 16.5% | 15.5% |
| $75,000 to $99,999 | 13.1% | 13.5% | 12.6% |
| $100,000 to $149,999 | 19.9% | 18.4% | 17.5% |
| $150,000 to $199,999 | 9.3% | 9.4% | 9.6% |
| $200,000 or more | 10.8% | 11.6% | 13.4% |
Source: U.S. Census ACS 5-year estimates (2024)


