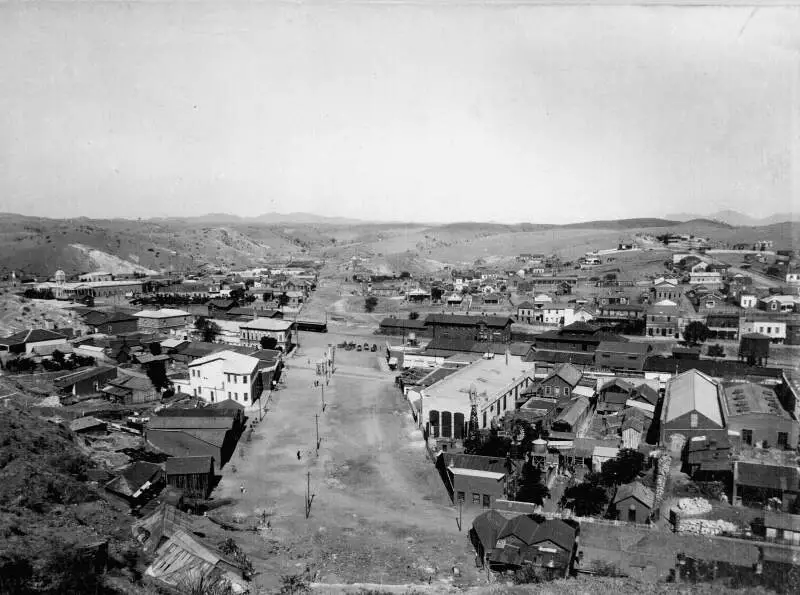
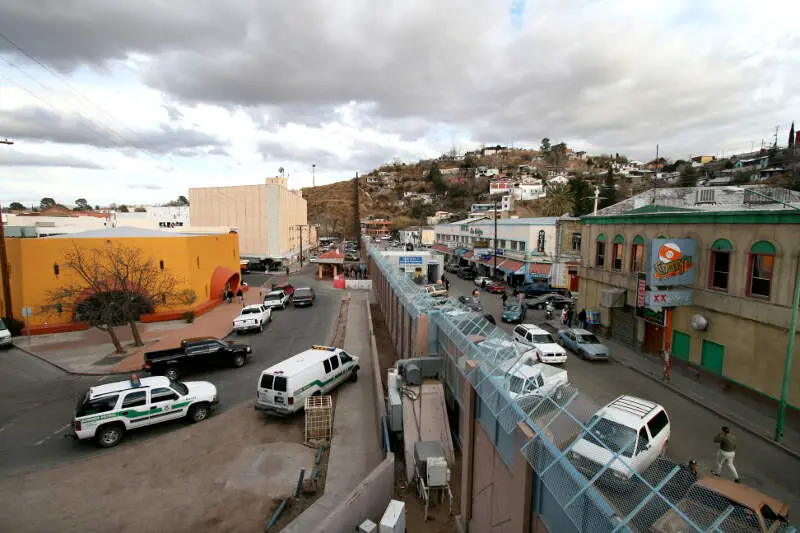
Nogales, AZ
Demographics And Statistics
Living In Nogales, Arizona Summary
Life in Nogales research summary. HomeSnacks has been using Saturday Night Science to research the quality of life in Nogales over the past nine years using Census, FBI, Zillow, and other primary data sources. Based on the most recently available data, we found the following about life in Nogales:
The population in Nogales is 19,753.
The median home value in Nogales is $215,447.
The median income in Nogales is $40,745.
The cost of living in Nogales is 92 which is 0.9x lower than the national average.
The median rent in Nogales is $691.
The unemployment rate in Nogales is 14.2%.
The poverty rate in Nogales is 26.1%.
The average high in Nogales is 78.7° and the average low is 47.0°.
Nogales SnackAbility
Overall SnackAbility
Nogales, AZ Crime Report
Crime in Nogales summary. We use data from the FBI to determine the crime rates in Nogales. Key points include:
There were 754 total crimes in Nogales in the last reporting year.
The overall crime rate per 100,000 people in Nogales is 3,830.1 / 100k people.
The violent crime rate per 100,000 people in Nogales is 228.6 / 100k people.
The property crime rate per 100,000 people in Nogales is 3,601.5 / 100k people.
Overall, crime in Nogales is 80.73% above the national average.
Total Crimes
Above National Average
Crime In Nogales Comparison Table
| Statistic | Count Raw |
Nogales / 100k People |
Arizona / 100k People |
National / 100k People |
|---|---|---|---|---|
| Total Crimes Per 100K | 754 | 3,830.1 | 2,214.0 | 2,119.2 |
| Violent Crime | 45 | 228.6 | 421.9 | 359.0 |
| Murder | 0 | 0.0 | 4.9 | 5.0 |
| Robbery | 0 | 0.0 | 64.6 | 61.0 |
| Aggravated Assault | 45 | 228.6 | 312.4 | 256.0 |
| Property Crime | 709 | 3,601.5 | 1,792.1 | 1,760.0 |
| Burglary | 94 | 477.5 | 217.8 | 229.0 |
| Larceny | 451 | 2,291.0 | 1,329.9 | 1,272.0 |
| Car Theft | 164 | 833.1 | 244.4 | 259.0 |
Nogales, AZ Cost Of Living
Cost of living in Nogales summary. We use data on the cost of living to determine how expensive it is to live in Nogales. Real estate prices drive most of the variance in cost of living around Arizona. Key points include:
The cost of living in Nogales is 92 with 100 being average.
The cost of living in Nogales is 0.9x lower than the national average.
The median home value in Nogales is $215,447.
The median income in Nogales is $40,745.
Nogales's Overall Cost Of Living
Lower Than The National Average
Cost Of Living In Nogales Comparison Table
| Living Expense | Nogales | Arizona | National Average | |
|---|---|---|---|---|
| Overall | 92 | 102 | 100 | |
| Services | 108 | 102 | 100 | |
| Groceries | 106 | 103 | 100 | |
| Health | 91 | 95 | 100 | |
| Housing | 65 | 99 | 100 | |
| Transportation | 109 | 107 | 100 | |
| Utilities | 100 | 96 | 100 | |
Nogales, AZ Weather
The average high in Nogales is 78.7° and the average low is 47.0°.
There are 38.6 days of precipitation each year.
Expect an average of 17.0 inches of precipitation each year with 0.9 inches of snow.
| Stat | Nogales |
|---|---|
| Average Annual High | 78.7 |
| Average Annual Low | 47.0 |
| Annual Precipitation Days | 38.6 |
| Average Annual Precipitation | 17.0 |
| Average Annual Snowfall | 0.9 |
Average High
Days of Rain
Nogales, AZ Photos
Rankings for Nogales in Arizona


Locations Around Nogales
Map Of Nogales, AZ
Best Places Around Nogales
Corona de Tucson, AZ
Population 9,039
Vail, AZ
Population 15,722
Sahuarita, AZ
Population 35,012
Green Valley, AZ
Population 21,581
Sierra Vista Southeast, AZ
Population 14,213
Sierra Vista, AZ
Population 45,203
Rio Rico, AZ
Population 21,798
Nogales Demographics And Statistics
Population over time in Nogales
The current population in Nogales is 19,753. The population has decreased -5.8% from 2010.
| Year | Population | % Change |
|---|---|---|
| 2023 | 19,753 | -0.0% |
| 2022 | 19,761 | -0.3% |
| 2021 | 19,829 | -1.7% |
| 2020 | 20,182 | -0.1% |
| 2019 | 20,201 | -0.4% |
| 2018 | 20,288 | 0.3% |
| 2017 | 20,233 | -0.6% |
| 2016 | 20,355 | -1.2% |
| 2015 | 20,601 | -0.5% |
| 2014 | 20,699 | -0.1% |
| 2013 | 20,724 | -0.6% |
| 2012 | 20,858 | -0.5% |
| 2011 | 20,958 | -0.1% |
| 2010 | 20,972 | - |
Race / Ethnicity in Nogales
Nogales is:
3.4% White with 681 White residents.
0.2% African American with 44 African American residents.
0.1% American Indian with 23 American Indian residents.
0.1% Asian with 18 Asian residents.
0.0% Hawaiian with 0 Hawaiian residents.
0.1% Other with 28 Other residents.
1.6% Two Or More with 311 Two Or More residents.
94.4% Hispanic with 18,648 Hispanic residents.
| Race | Nogales | AZ | USA |
|---|---|---|---|
| White | 3.4% | 53.4% | 58.2% |
| African American | 0.2% | 4.4% | 12.0% |
| American Indian | 0.1% | 3.4% | 0.5% |
| Asian | 0.1% | 3.3% | 5.7% |
| Hawaiian | 0.0% | 0.2% | 0.2% |
| Other | 0.1% | 0.4% | 0.5% |
| Two Or More | 1.6% | 3.9% | 3.9% |
| Hispanic | 94.4% | 31.0% | 19.0% |
Gender in Nogales
Nogales is 53.4% female with 10,550 female residents.
Nogales is 46.6% male with 9,203 male residents.
| Gender | Nogales | AZ | USA |
|---|---|---|---|
| Female | 53.4% | 50.1% | 50.5% |
| Male | 46.6% | 49.9% | 49.5% |
Highest level of educational attainment in Nogales for adults over 25
15.0% of adults in Nogales completed < 9th grade.
16.0% of adults in Nogales completed 9-12th grade.
27.0% of adults in Nogales completed high school / ged.
17.0% of adults in Nogales completed some college.
6.0% of adults in Nogales completed associate's degree.
12.0% of adults in Nogales completed bachelor's degree.
4.0% of adults in Nogales completed master's degree.
2.0% of adults in Nogales completed professional degree.
1.0% of adults in Nogales completed doctorate degree.
| Education | Nogales | AZ | USA |
|---|---|---|---|
| < 9th Grade | 15.0% | 6.0% | 5.0% |
| 9-12th Grade | 16.0% | 6.0% | 6.0% |
| High School / GED | 27.0% | 23.0% | 26.0% |
| Some College | 17.0% | 24.0% | 19.0% |
| Associate's Degree | 6.0% | 9.0% | 9.0% |
| Bachelor's Degree | 12.0% | 20.0% | 21.0% |
| Master's Degree | 4.0% | 9.0% | 10.0% |
| Professional Degree | 2.0% | 2.0% | 2.0% |
| Doctorate Degree | 1.0% | 1.0% | 2.0% |
Household Income For Nogales, Arizona
9.2% of households in Nogales earn Less than $10,000.
8.9% of households in Nogales earn $10,000 to $14,999.
12.1% of households in Nogales earn $15,000 to $24,999.
15.0% of households in Nogales earn $25,000 to $34,999.
13.6% of households in Nogales earn $35,000 to $49,999.
18.8% of households in Nogales earn $50,000 to $74,999.
6.5% of households in Nogales earn $75,000 to $99,999.
9.9% of households in Nogales earn $100,000 to $149,999.
2.8% of households in Nogales earn $150,000 to $199,999.
3.1% of households in Nogales earn $200,000 or more.
| Income | Nogales | AZ | USA |
|---|---|---|---|
| Less than $10,000 | 9.2% | 4.9% | 4.9% |
| $10,000 to $14,999 | 8.9% | 2.9% | 3.6% |
| $15,000 to $24,999 | 12.1% | 6.1% | 6.6% |
| $25,000 to $34,999 | 15.0% | 6.9% | 6.8% |
| $35,000 to $49,999 | 13.6% | 10.9% | 10.4% |
| $50,000 to $74,999 | 18.8% | 17.0% | 15.7% |
| $75,000 to $99,999 | 6.5% | 13.6% | 12.7% |
| $100,000 to $149,999 | 9.9% | 18.1% | 17.4% |
| $150,000 to $199,999 | 2.8% | 9.0% | 9.3% |
| $200,000 or more | 3.1% | 10.6% | 12.6% |


