Sierra Vista SnackAbility
Overall SnackAbility
Crime in Sierra Vista summary. We use data from the FBI to determine the crime rates in Sierra Vista. Key points include:
There were 830 total crimes in Sierra Vista in the last reporting year.
The overall crime rate per 100,000 people in Sierra Vista is 1,881.3 / 100k people.
The violent crime rate per 100,000 people in Sierra Vista is 217.6 / 100k people.
The property crime rate per 100,000 people in Sierra Vista is 1,663.7 / 100k people.
Overall, crime in Sierra Vista is -11.23% below the national average.
Total Crimes
Below National Average
Crime In Sierra Vista Comparison Table
| Statistic | Count Raw |
Sierra Vista / 100k People |
Arizona / 100k People |
National / 100k People |
|---|---|---|---|---|
| Total Crimes Per 100K | 830 | 1,881.3 | 2,214.0 | 2,119.2 |
| Violent Crime | 96 | 217.6 | 421.9 | 359.0 |
| Murder | 1 | 2.3 | 4.9 | 5.0 |
| Robbery | 11 | 24.9 | 64.6 | 61.0 |
| Aggravated Assault | 75 | 170.0 | 312.4 | 256.0 |
| Property Crime | 734 | 1,663.7 | 1,792.1 | 1,760.0 |
| Burglary | 73 | 165.5 | 217.8 | 229.0 |
| Larceny | 626 | 1,418.9 | 1,329.9 | 1,272.0 |
| Car Theft | 35 | 79.3 | 244.4 | 259.0 |
Source: FBI Uniform Crime Reporting (2024)
Cost of living in Sierra Vista summary. We use data on the cost of living to determine how expensive it is to live in Sierra Vista. Real estate prices drive most of the variance in cost of living around Arizona. Key points include:
The cost of living in Sierra Vista is 102 with 100 being average.
The cost of living in Sierra Vista is 1.0x higher than the national average.
The median home value in Sierra Vista is $298,883.
The median income in Sierra Vista is $70,291.
Sierra Vista's Overall Cost Of Living
Higher Than The National Average
Cost Of Living In Sierra Vista Comparison Table
| Living Expense | Sierra Vista | Arizona | National Average |
|---|---|---|---|
| Overall | 102 | 100 | 100 |
| Services | 101 | 99 | 100 |
| Groceries | 103 | 99 | 100 |
| Health | 99 | 97 | 100 |
| Housing | 102 | 104 | 100 |
| Transportation | 109 | 113 | 100 |
| Utilities | 106 | 104 | 100 |
Source: Cost of living index, normalized to US average = 100
Sierra Vista, AZ Weather
The average high in Sierra Vista is 78.1° and the average low is 47.2°.
There are 33.2 days of precipitation each year.
Expect an average of 14.0 inches of precipitation each year with 1.7 inches of snow.
| Stat | Sierra Vista |
|---|---|
| Average Annual High | 78.1 |
| Average Annual Low | 47.2 |
| Annual Precipitation Days | 33.2 |
| Average Annual Precipitation | 14.0 |
| Average Annual Snowfall | 1.7 |
Average High
Days of Rain
Source: NOAA climate normals (30-year)
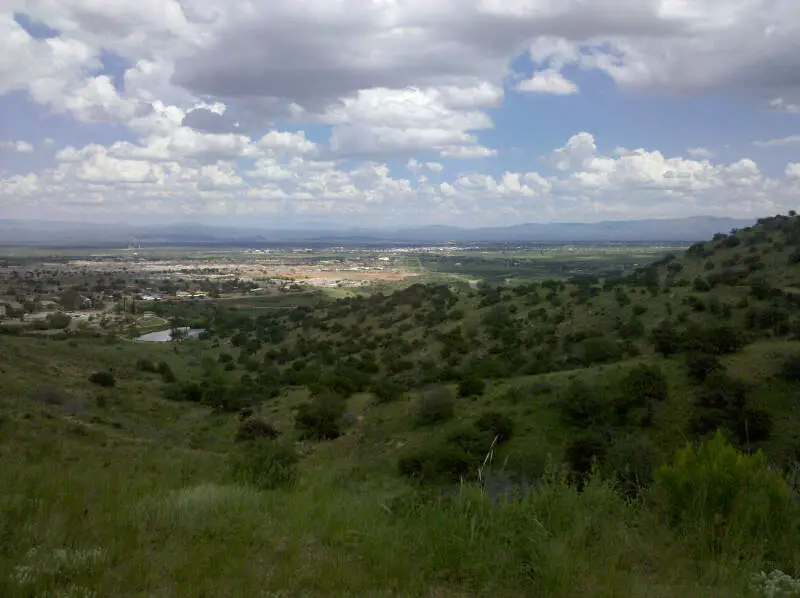
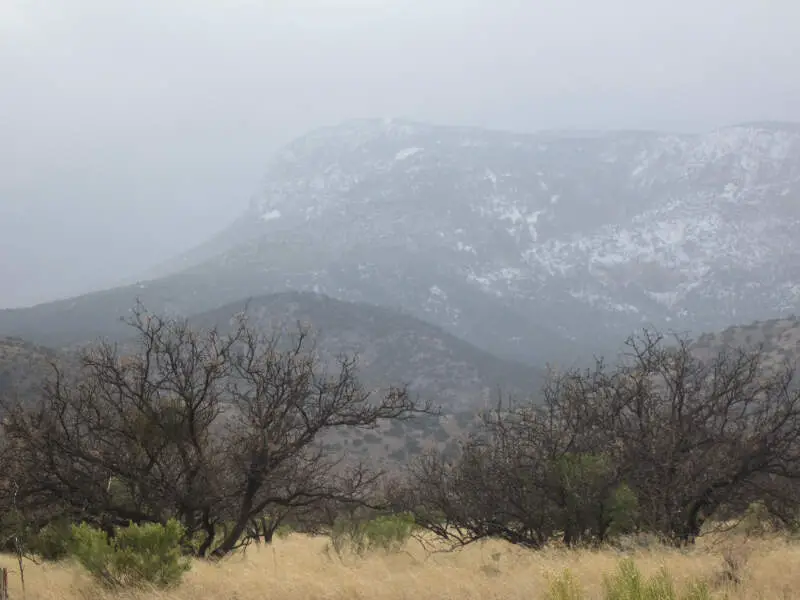
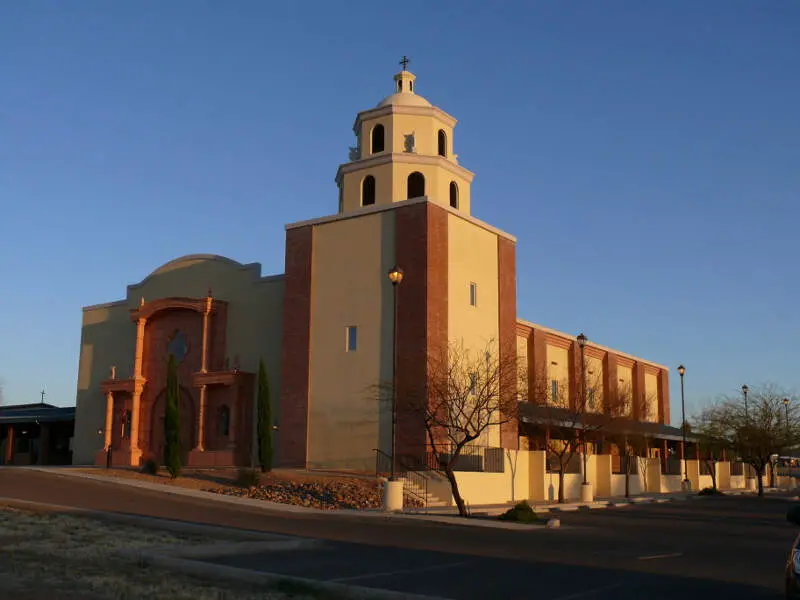
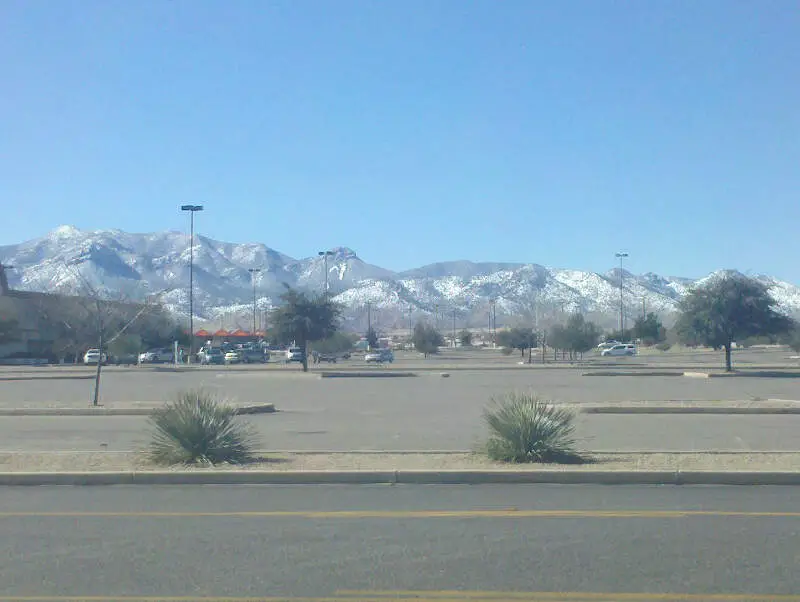
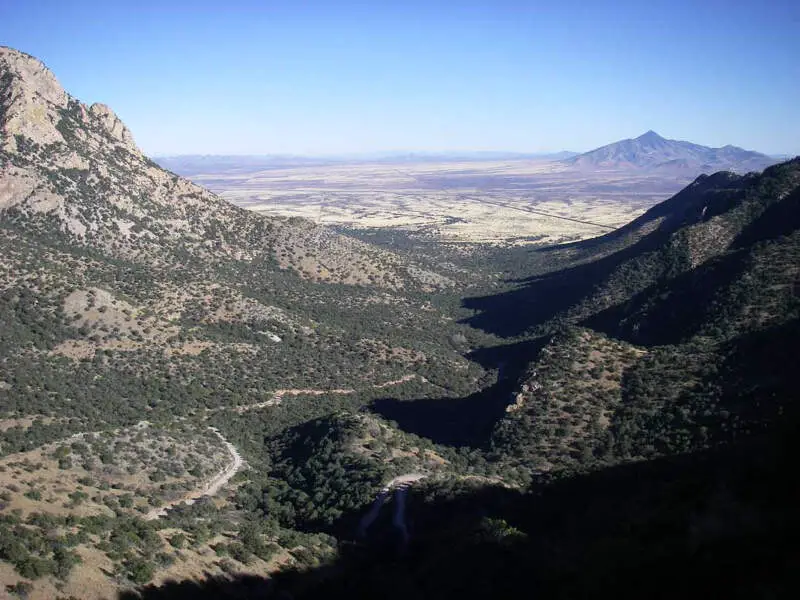
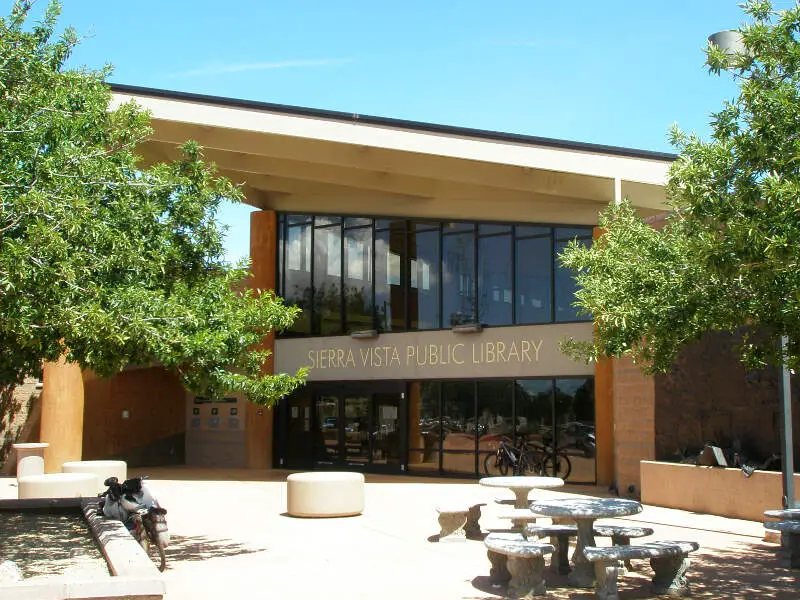
Sierra Vista, AZ Photos
1 Reviews & Comments About Sierra Vista

Education s***s as of now for children, way too many drugs in the town, just an overall non-friendly environment.
Bad public education, people
Rankings & Articles For Sierra Vista


Locations Around Sierra Vista
Map Of Sierra Vista, AZ
Best Places Around Sierra Vista
Corona de Tucson, AZ
Population 9,566
Vail, AZ
Population 16,315
Sahuarita, AZ
Population 35,862
Green Valley, AZ
Population 22,114
Sierra Vista Southeast, AZ
Population 14,330
Rio Rico, AZ
Population 22,017
Bisbee, AZ
Population 4,977
Benson, AZ
Population 5,417
Douglas, AZ
Population 15,981
Nogales, AZ
Population 19,841
Sierra Vista Demographics And Statistics
Population over time in Sierra Vista
The current population in Sierra Vista is 45,155. The population has increased 5.2% from 2010.
| Year | Population | % Change |
|---|---|---|
| 2024 | 45,155 | -0.1% |
| 2023 | 45,203 | -0.0% |
| 2022 | 45,212 | 0.6% |
| 2021 | 44,944 | 2.7% |
| 2020 | 43,756 | 0.8% |
| 2019 | 43,398 | -0.3% |
| 2018 | 43,550 | -0.1% |
| 2017 | 43,585 | -1.8% |
| 2016 | 44,381 | -1.1% |
| 2015 | 44,892 | -1.0% |
| 2014 | 45,365 | 0.4% |
| 2013 | 45,187 | 0.9% |
| 2012 | 44,774 | 1.8% |
| 2011 | 43,970 | 2.5% |
| 2010 | 42,904 | - |
Race / Ethnicity in Sierra Vista
See the full breakdown
Sierra Vista is:
56.8% White with 25,648 White residents.
6.2% African American with 2,788 African American residents.
0.3% American Indian with 155 American Indian residents.
3.5% Asian with 1,591 Asian residents.
0.5% Hawaiian with 210 Hawaiian residents.
0.8% Other with 358 Other residents.
8.4% Two Or More with 3,795 Two Or More residents.
23.5% Hispanic with 10,610 Hispanic residents.
| Race | Sierra Vista | AZ | USA |
|---|---|---|---|
| White | 56.8% | 52.6% | 57.4% |
| African American | 6.2% | 4.4% | 11.9% |
| American Indian | 0.3% | 3.2% | 0.5% |
| Asian | 3.5% | 3.5% | 5.9% |
| Hawaiian | 0.5% | 0.2% | 0.2% |
| Other | 0.8% | 0.5% | 0.6% |
| Two Or More | 8.4% | 4.4% | 4.3% |
| Hispanic | 23.5% | 31.4% | 19.3% |
Gender in Sierra Vista
See the full breakdown
Sierra Vista is 50.1% female with 22,625 female residents.
Sierra Vista is 49.9% male with 22,530 male residents.
| Gender | Sierra Vista | AZ | USA |
|---|---|---|---|
| Female | 50.1% | 50.1% | 50.5% |
| Male | 49.9% | 49.9% | 49.5% |
Highest level of educational attainment in Sierra Vista for adults over 25
See the full breakdown
1.0% of adults in Sierra Vista completed < 9th grade.
4.0% of adults in Sierra Vista completed 9-12th grade.
22.0% of adults in Sierra Vista completed high school / ged.
25.0% of adults in Sierra Vista completed some college.
13.0% of adults in Sierra Vista completed associate's degree.
21.0% of adults in Sierra Vista completed bachelor's degree.
11.0% of adults in Sierra Vista completed master's degree.
2.0% of adults in Sierra Vista completed professional degree.
1.0% of adults in Sierra Vista completed doctorate degree.
| Education | Sierra Vista | AZ | USA |
|---|---|---|---|
| < 9th Grade | 1.0% | 6.0% | 4.0% |
| 9-12th Grade | 4.0% | 6.0% | 6.0% |
| High School / GED | 22.0% | 23.0% | 26.0% |
| Some College | 25.0% | 23.0% | 19.0% |
| Associate's Degree | 13.0% | 9.0% | 9.0% |
| Bachelor's Degree | 21.0% | 20.0% | 22.0% |
| Master's Degree | 11.0% | 9.0% | 10.0% |
| Professional Degree | 2.0% | 2.0% | 2.0% |
| Doctorate Degree | 1.0% | 2.0% | 2.0% |
Household Income For Sierra Vista, Arizona
See the full breakdown
5.7% of households in Sierra Vista earn Less than $10,000.
4.0% of households in Sierra Vista earn $10,000 to $14,999.
6.4% of households in Sierra Vista earn $15,000 to $24,999.
8.2% of households in Sierra Vista earn $25,000 to $34,999.
10.6% of households in Sierra Vista earn $35,000 to $49,999.
17.9% of households in Sierra Vista earn $50,000 to $74,999.
12.0% of households in Sierra Vista earn $75,000 to $99,999.
20.4% of households in Sierra Vista earn $100,000 to $149,999.
10.0% of households in Sierra Vista earn $150,000 to $199,999.
4.7% of households in Sierra Vista earn $200,000 or more.
| Income | Sierra Vista | AZ | USA |
|---|---|---|---|
| Less than $10,000 | 5.7% | 5.0% | 5.0% |
| $10,000 to $14,999 | 4.0% | 2.7% | 3.4% |
| $15,000 to $24,999 | 6.4% | 5.8% | 6.3% |
| $25,000 to $34,999 | 8.2% | 6.6% | 6.6% |
| $35,000 to $49,999 | 10.6% | 10.5% | 10.1% |
| $50,000 to $74,999 | 17.9% | 16.5% | 15.5% |
| $75,000 to $99,999 | 12.0% | 13.5% | 12.6% |
| $100,000 to $149,999 | 20.4% | 18.4% | 17.5% |
| $150,000 to $199,999 | 10.0% | 9.4% | 9.6% |
| $200,000 or more | 4.7% | 11.6% | 13.4% |
Source: U.S. Census ACS 5-year estimates (2024)


