
Some of you might be asking yourself, at this very moment, is Oklahoma a good place?
The answer is unequivocally yes… if you know where to locate the best counties to live in Oklahoma.
Lucky for you, we’re here to help you identify the best counties to live in the Sooner State based on the most recently available data from the Census. And this isn’t our first rodeo — we’ve been using Saturday Night Science to rank places for years.
The question becomes if you wanted to relocate to the best part of Oklahoma, where would you go? To answer that, we looked at crime, cost of living, and demographic data for all 77 counties in the state.
Table Of Contents: Top Ten | Methodology | Table | FAQs | Summary
The 10 Best Counties To Live In Oklahoma For 2026
Canadian County is the county to be when it comes to living the good life in Oklahoma. And you should avoid Harmon County if you can — at least according to the data.
Now you know exactly where to move in Oklahoma. Keep on reading for more about the top ten and a detailed methodology.
Or, check out the best places to live in Oklahoma and the cheapest places to live in Oklahoma.
Table Of Contents: Top Ten | Methodology | Summary | Table
The Best Counties To Live In Oklahoma For 2026
1. Canadian County
Biggest Place: Oklahoma City
Population: 168,985
Median Income: $87,751 (best)
Median Home Price: $271,852 (6th best)
Unemployment Rate: 4.5% (27th best)
More on Canadian County: Data
2. Wagoner County
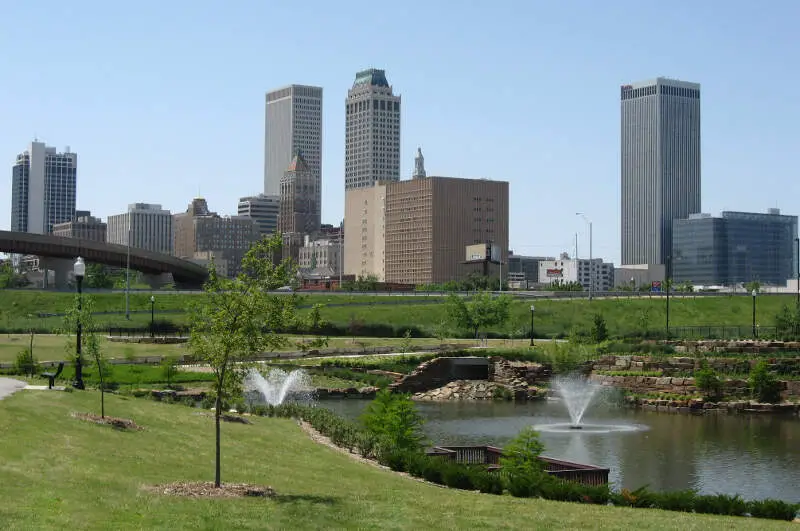
Biggest Place: Tulsa
Population: 86,609
Median Income: $81,207 (4th best)
Median Home Price: $279,885 (4th best)
Unemployment Rate: 4.2% (2best)
More on Wagoner County: Data
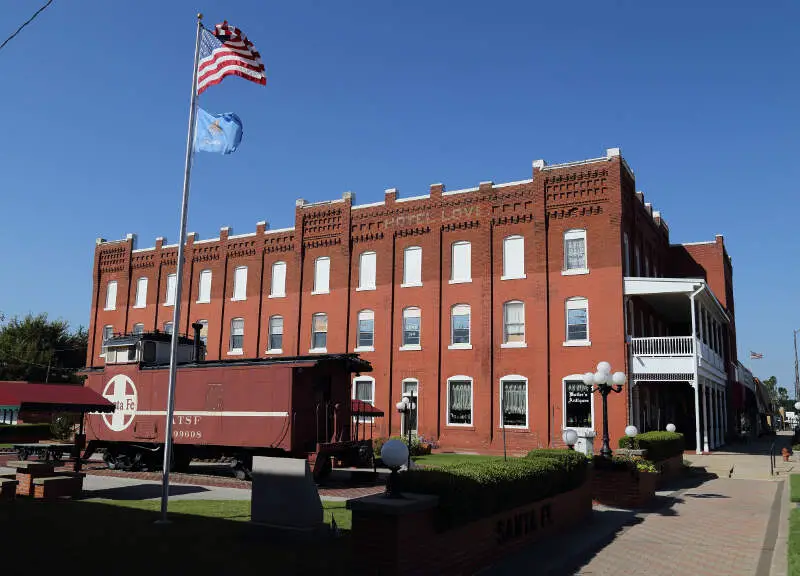
3. Logan County
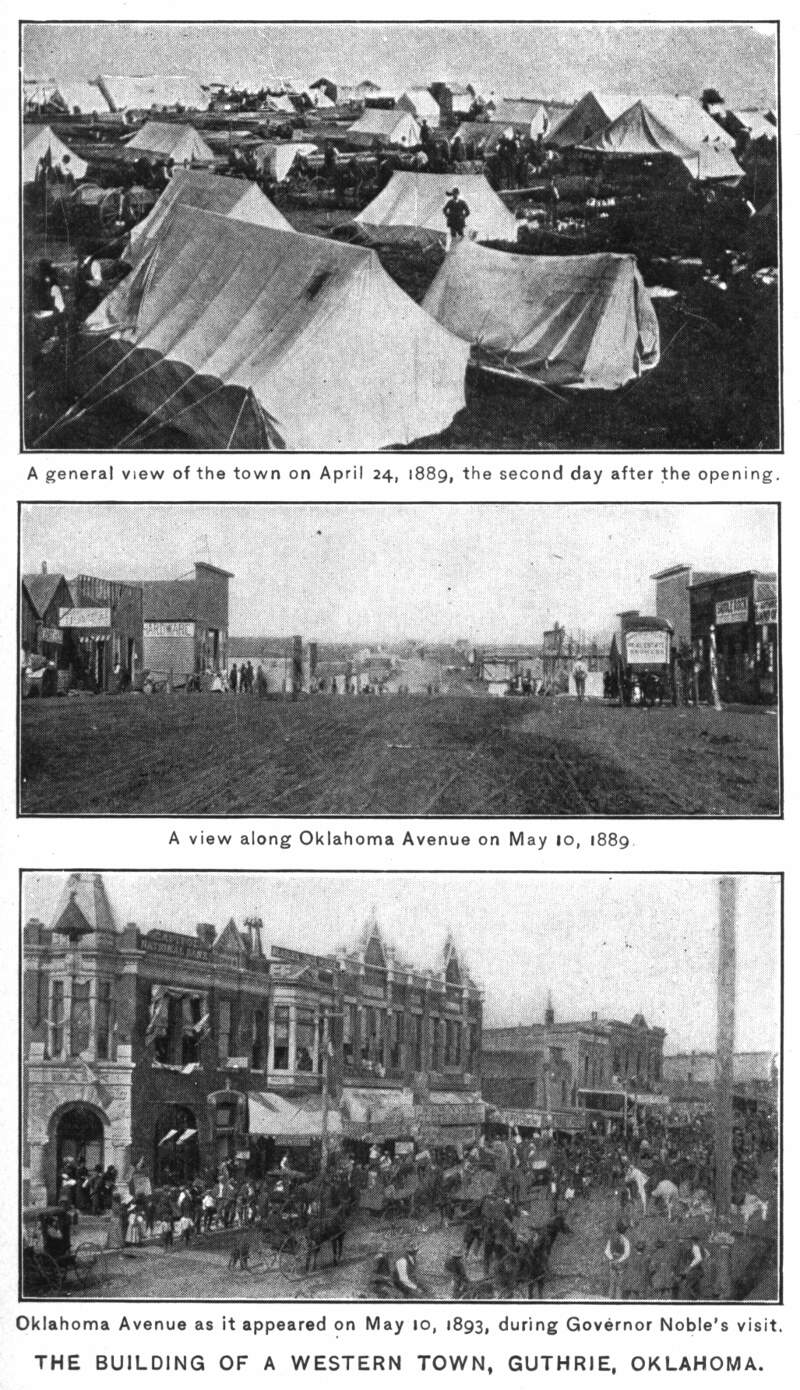
Biggest Place: Guthrie
Population: 51,938
Median Income: $83,899 (3rd best)
Median Home Price: $310,210 (best)
Unemployment Rate: 3.6% (16th best)
More on Logan County: Data
4. Rogers County

Biggest Place: Tulsa
Population: 98,610
Median Income: $80,067 (5th best)
Median Home Price: $278,995 (5th best)
Unemployment Rate: 4.7% (36th best)
More on Rogers County: Data
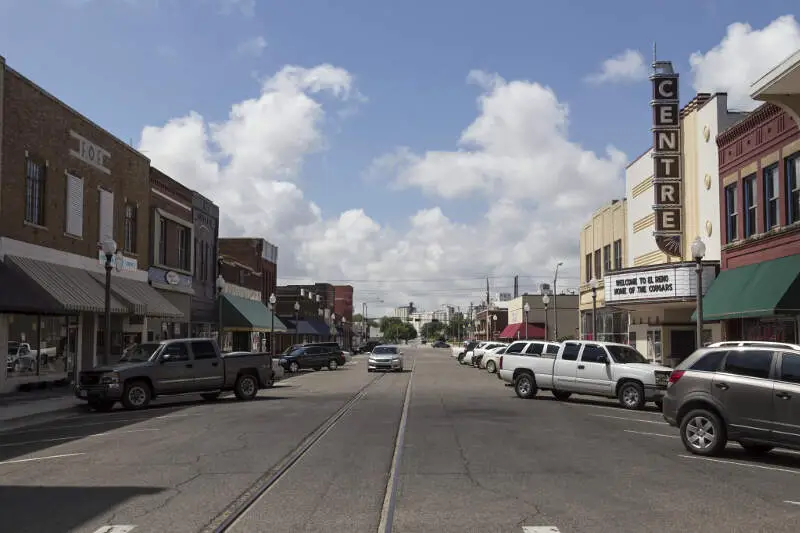
5. Mcclain County
Biggest Place: Newcastle
Population: 45,273
Median Income: $84,552 (2nd best)
Median Home Price: $283,498 (2nd best)
Unemployment Rate: 4.7% (33rd best)
More on Mcclain County: Data
6. Major County
Biggest Place: Fairview
Population: 7,628
Median Income: $71,266 (9th best)
Median Home Price: $163,825 (38th best)
Unemployment Rate: 2.6% (7th best)
More on Major County: Data
7. Kingfisher County
Biggest Place: Piedmont
Population: 15,430
Median Income: $71,975 (8th best)
Median Home Price: $228,625 (11th best)
Unemployment Rate: 2.1% (2nd best)
More on Kingfisher County: Data
8. Cleveland County
Biggest Place: Oklahoma City
Population: 300,047
Median Income: $77,068 (6th best)
Median Home Price: $254,108 (7th best)
Unemployment Rate: 4.8% (39th best)
More on Cleveland County: Data
9. Roger Mills County
Biggest Place: Cheyenne
Population: 3,359
Median Income: $66,094 (16th best)
Median Home Price: $190,525 (25th best)
Unemployment Rate: 3.2% (9th best)
More on Roger Mills County: Data
10. Noble County
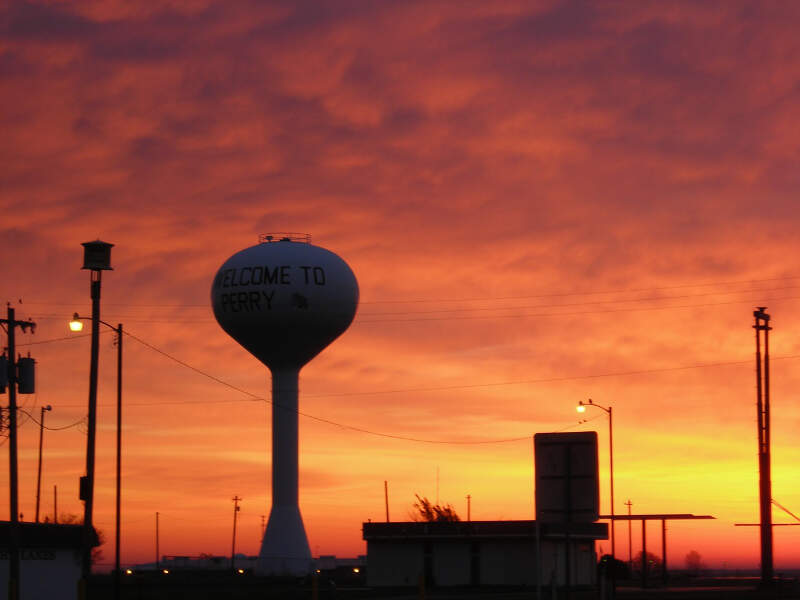
Biggest Place: Perry
Population: 10,897
Median Income: $66,365 (13th best)
Median Home Price: $153,667 (42nd best)
Unemployment Rate: 2.6% (6th best)
More on Noble County: Data
Methodology: How do you determine which Oklahoma county is the best?
To give you the best county in Oklahoma, we have to look at a handful of metrics that signal the quality of a place. To do that, we made assumptions about what’s in a “best county” and what isn’t. For reference, we are trying to make the kind of argument you’d make at a bar using facts, Saturday Night Science.
With that in mind, we went to two of the best data sources on the internet. Namely, the American Community Survey data and FBI Crime data for the most recent period.
We paid particular attention to:
- Violent Crime Rates
- Property Crime Rates
- Median Home Values
- Median Income
- Unemployment Rates
- Adult Education Levels
- Health Insurance Coverage
- Poverty Rates
We then ranked each county in Oklahoma across each of the criteria from one to 77, with one being the best.
Taking the average rank across all criteria, we created a quality of life score with the county posting the lowest overall score being the “Best County To Live In Oklahoma.”
The result is some of the safest, quietest, and best counties to raise a family in the Sooner State.
We updated this article for 2026. This report is our eleventh time ranking the best counties to live in Oklahoma.
Read on to see why Canadian County is the best county, while Harmon County is probably in contention for being the worst county in Oklahoma.
Summary: The Best Counties In Oklahoma To Call Home For 2026
Living in Oklahoma can vary from one part of the state to the next — who woulda thought?
The best counties in Oklahoma are Canadian County, Wagoner County, Logan County, Rogers County, McClain County, Major County, Kingfisher County, Cleveland County, Roger Mills County, and Noble County.
But now you know the outstanding parts and the parts to avoid, and that’s why you came here to learn at the end of the day.
You are welcome.
Here’s a look at the worst counties in Oklahoma according to the data:
- Harmon County
- Coal County
- Adair County
For more Oklahoma reading, check out:
- Best Places To Retire In Oklahoma
- Best Counties To Live In Oklahoma
- Best Places To Raise A Family In Oklahoma
- Best Places To Buy A House In Oklahoma
Detailed List Of The Best Counties In Oklahoma
| Rank | County | Population | Median Income | Median Home Price |
|---|---|---|---|---|
| 1 | Canadian County | 168,985 | $87,751 | $271,852 |
| 2 | Wagoner County | 86,609 | $81,207 | $279,885 |
| 3 | Logan County | 51,938 | $83,899 | $310,210 |
| 4 | Rogers County | 98,610 | $80,067 | $278,995 |
| 5 | Mcclain County | 45,273 | $84,552 | $283,498 |
| 6 | Major County | 7,628 | $71,266 | $163,825 |
| 7 | Kingfisher County | 15,430 | $71,975 | $228,625 |
| 8 | Cleveland County | 300,047 | $77,068 | $254,108 |
| 9 | Roger Mills County | 3,359 | $66,094 | $190,525 |
| 10 | Noble County | 10,897 | $66,365 | $153,667 |
| 11 | Creek County | 72,830 | $62,338 | $213,539 |
| 12 | Grady County | 56,606 | $75,419 | $243,872 |
| 13 | Washington County | 53,326 | $60,162 | $181,475 |
| 14 | Osage County | 45,997 | $62,847 | $212,533 |
| 15 | Pontotoc County | 38,235 | $63,017 | $186,278 |
| 16 | Murray County | 13,753 | $66,322 | $167,636 |
| 17 | Tulsa County | 680,794 | $69,009 | $250,969 |
| 18 | Oklahoma County | 806,199 | $66,679 | $223,511 |
| 19 | Dewey County | 4,360 | $62,569 | $131,201 |
| 20 | Lincoln County | 34,219 | $62,216 | $190,937 |
| 21 | Grant County | 4,131 | $60,758 | $111,617 |
| 22 | Custer County | 28,259 | $59,738 | $177,100 |
| 23 | Beaver County | 5,028 | $64,276 | $141,508 |
| 24 | Garfield County | 62,146 | $66,182 | $141,163 |
| 25 | Pottawatomie County | 73,463 | $61,398 | $193,286 |
| 26 | Carter County | 48,555 | $60,723 | $175,046 |
| 27 | Harper County | 3,203 | $64,053 | $78,874 |
| 28 | Ellis County | 3,683 | $61,016 | $101,242 |
| 29 | Cotton County | 5,485 | $58,425 | $106,640 |
| 30 | Love County | 10,261 | $66,580 | $196,531 |
| 31 | Nowata County | 9,435 | $54,333 | $174,334 |
| 32 | Alfalfa County | 5,696 | $64,615 | $82,286 |
| 33 | Texas County | 20,774 | $60,069 | $164,949 |
| 34 | Woods County | 8,596 | $53,275 | $113,744 |
| 35 | Bryan County | 48,253 | $57,225 | $226,172 |
| 36 | Payne County | 82,972 | $49,809 | $240,041 |
| 37 | Cimarron County | 2,218 | $62,188 | $74,095 |
| 38 | Pawnee County | 15,795 | $58,738 | $177,257 |
| 39 | Washita County | 10,815 | $63,501 | $104,799 |
| 40 | Delaware County | 41,279 | $56,676 | $283,423 |
| 41 | Stephens County | 43,551 | $61,620 | $140,531 |
| 42 | Mayes County | 39,604 | $60,305 | $214,223 |
| 43 | Garvin County | 25,860 | $58,556 | $149,321 |
| 44 | Kay County | 43,625 | $58,423 | $112,217 |
| 45 | Comanche County | 121,825 | $60,761 | $153,467 |
| 46 | Cherokee County | 47,942 | $53,218 | $206,367 |
| 47 | Woodward County | 20,158 | $61,417 | $136,509 |
| 48 | Marshall County | 15,792 | $57,245 | $204,181 |
| 49 | Jackson County | 24,678 | $62,799 | $111,153 |
| 50 | Atoka County | 14,379 | $54,785 | $216,054 |
| 51 | Johnston County | 10,278 | $52,688 | $156,360 |
| 52 | Muskogee County | 66,444 | $53,619 | $154,981 |
| 53 | Mccurtain County | 30,863 | $51,929 | $203,314 |
| 54 | Ottawa County | 30,341 | $49,947 | $137,118 |
| 55 | Sequoyah County | 39,860 | $51,093 | $187,928 |
| 56 | Craig County | 14,302 | $51,922 | $196,075 |
| 57 | Blaine County | 8,570 | $61,642 | $107,344 |
| 58 | Greer County | 5,489 | $59,406 | $71,503 |
| 59 | Kiowa County | 8,383 | $44,962 | $74,050 |
| 60 | Okmulgee County | 36,899 | $54,029 | $131,437 |
| 61 | Le Flore County | 49,053 | $51,565 | $168,962 |
| 62 | Pittsburg County | 43,561 | $55,310 | $147,672 |
| 63 | Okfuskee County | 11,278 | $48,363 | $148,012 |
| 64 | Pushmataha County | 10,790 | $47,940 | $154,925 |
| 65 | Beckham County | 22,148 | $53,328 | $150,788 |
| 66 | Caddo County | 26,447 | $55,353 | $97,171 |
| 67 | Hughes County | 13,389 | $51,581 | $116,879 |
| 68 | Mcintosh County | 19,400 | $46,281 | $188,314 |
| 69 | Tillman County | 6,910 | $48,939 | $57,724 |
| 70 | Choctaw County | 14,297 | $44,081 | $137,080 |
| 71 | Haskell County | 11,683 | $49,806 | $152,477 |
| 72 | Jefferson County | 5,380 | $48,668 | $95,197 |
| 73 | Latimer County | 9,518 | $41,405 | $141,925 |
| 74 | Seminole County | 23,494 | $48,062 | $120,902 |
| 75 | Adair County | 19,575 | $48,041 | $171,380 |
| 76 | Coal County | 5,320 | $50,423 | $131,717 |
| 77 | Harmon County | 2,406 | $43,333 | $65,630 |