Berkeley SnackAbility
Overall SnackAbility
Crime in Berkeley summary. We use data from the FBI to determine the crime rates in Berkeley. Key points include:
There were 6,889 total crimes in Berkeley in the last reporting year.
The overall crime rate per 100,000 people in Berkeley is 5,868.0 / 100k people.
The violent crime rate per 100,000 people in Berkeley is 638.8 / 100k people.
The property crime rate per 100,000 people in Berkeley is 5,229.1 / 100k people.
Overall, crime in Berkeley is 176.89% above the national average.
Total Crimes
Above National Average
Crime In Berkeley Comparison Table
| Statistic | Count Raw |
Berkeley / 100k People |
California / 100k People |
National / 100k People |
|---|---|---|---|---|
| Total Crimes Per 100K | 6,889 | 5,868.0 | 2,564.5 | 2,119.2 |
| Violent Crime | 750 | 638.8 | 486.0 | 359.0 |
| Murder | 7 | 6.0 | 4.5 | 5.0 |
| Robbery | 219 | 186.5 | 119.1 | 61.0 |
| Aggravated Assault | 470 | 400.3 | 325.8 | 256.0 |
| Property Crime | 6,139 | 5,229.1 | 2,078.4 | 1,760.0 |
| Burglary | 776 | 661.0 | 305.8 | 229.0 |
| Larceny | 4,292 | 3,655.9 | 1,345.2 | 1,272.0 |
| Car Theft | 1,071 | 912.3 | 427.5 | 259.0 |
Source: FBI Uniform Crime Reporting (2024)
Cost of living in Berkeley summary. We use data on the cost of living to determine how expensive it is to live in Berkeley. Real estate prices drive most of the variance in cost of living around California. Key points include:
The cost of living in Berkeley is 222 with 100 being average.
The cost of living in Berkeley is 2.2x higher than the national average.
The median home value in Berkeley is $1,443,683.
The median income in Berkeley is $108,092.
Berkeley's Overall Cost Of Living
Higher Than The National Average
Cost Of Living In Berkeley Comparison Table
| Living Expense | Berkeley | California | National Average |
|---|---|---|---|
| Overall | 222 | 142 | 100 |
| Services | 116 | 110 | 100 |
| Groceries | 112 | 118 | 100 |
| Health | 451 | 197 | 100 |
| Housing | 127 | 120 | 100 |
| Transportation | 125 | 121 | 100 |
| Utilities | 134 | 121 | 100 |
Source: Cost of living index, normalized to US average = 100
Berkeley, CA Weather
The average high in Berkeley is 67.8° and the average low is 49.9°.
There are 42.8 days of precipitation each year.
Expect an average of 21.8 inches of precipitation each year with 0.0 inches of snow.
| Stat | Berkeley |
|---|---|
| Average Annual High | 67.8 |
| Average Annual Low | 49.9 |
| Annual Precipitation Days | 42.8 |
| Average Annual Precipitation | 21.8 |
| Average Annual Snowfall | 0.0 |
Average High
Days of Rain
Source: NOAA climate normals (30-year)
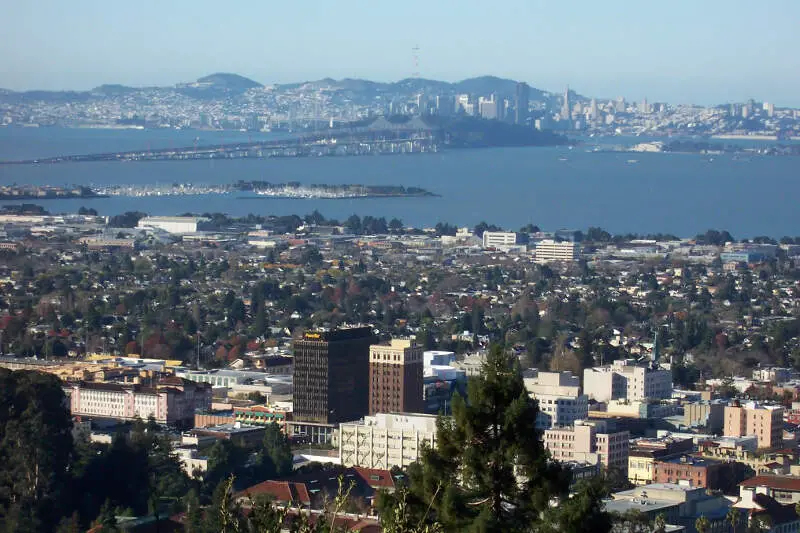
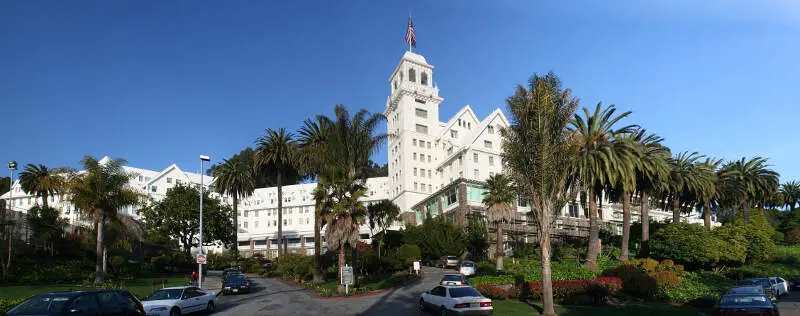
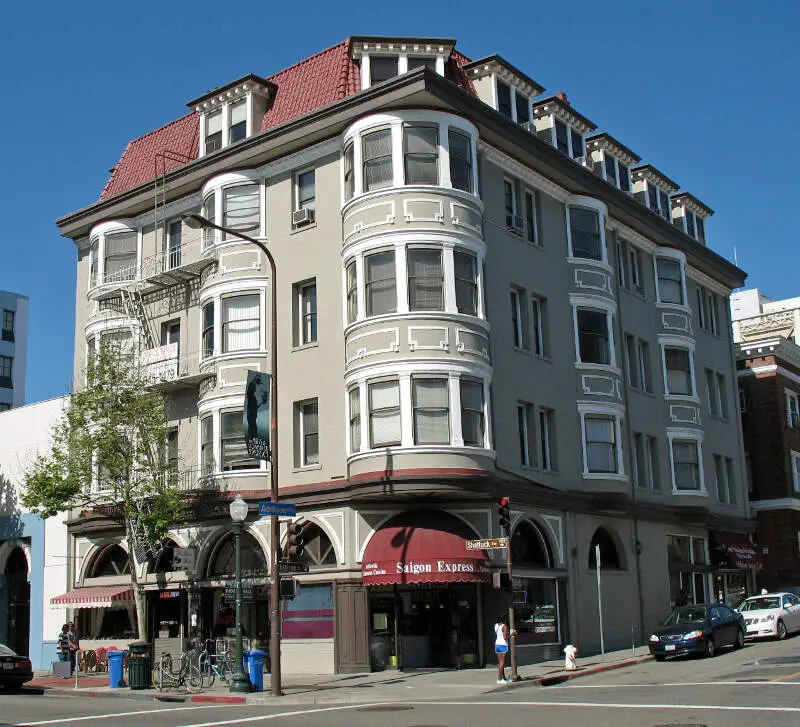
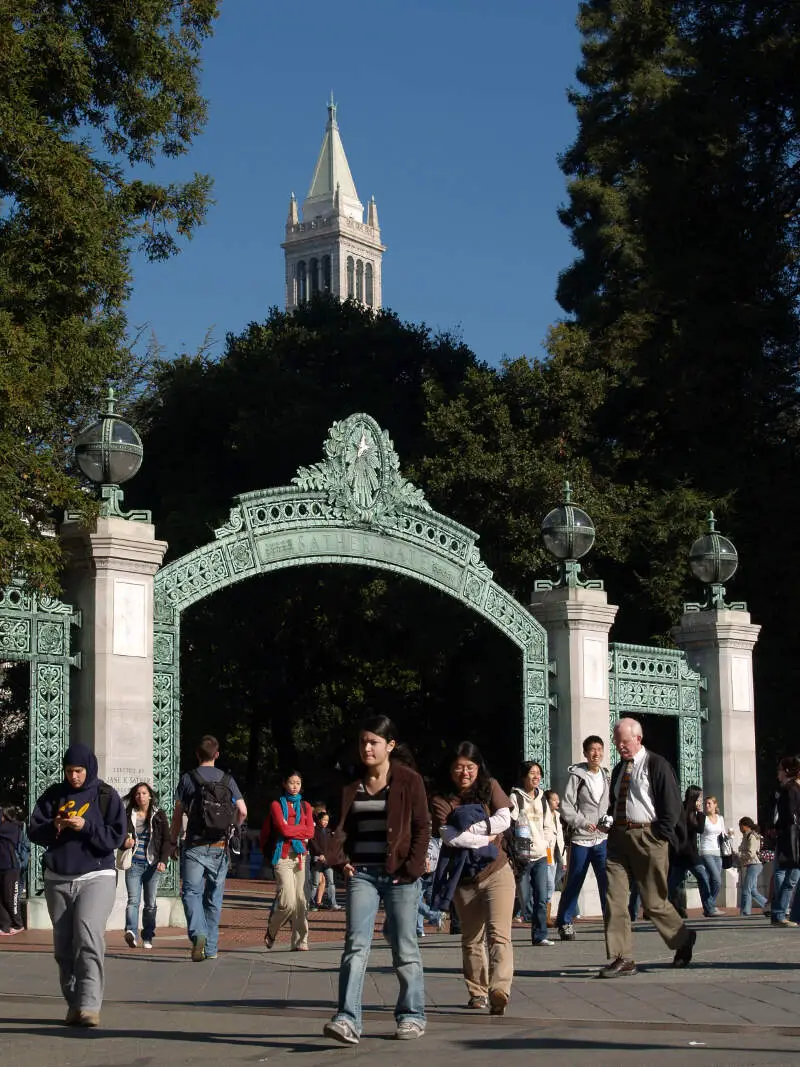
Berkeley, CA Photos


1 Reviews & Comments About Berkeley

Berkeley welcomes all homeless, does nothing to dissuade transient crime, bums are deeply comfortable strewing their trash and feces all over the streets and have taken over downtown.
Berkeley is the perfect college town! There are so many amazing places to eat and hangout, and the weather is usually pretty nice.
Berkeley is a wonderful city full of an interesting, open-minded and intelligent group of people. The city is very culturally diverse and open to accepting anyone from anywhere. The food scene is to die for and if organically grown is what you live by, look no further than Berkeley grocery stores, farmers markets and more.
Rankings & Articles For Berkeley


Locations Around Berkeley
Map Of Berkeley, CA
Best Places Around Berkeley
Piedmont, CA
Population 10,945
San Lorenzo, CA
Population 29,171
San Bruno, CA
Population 42,307
Kensington, CA
Population 5,179
Lucas Valley-Marinwood, CA
Population 6,473
Millbrae, CA
Population 22,689
Fairfax, CA
Population 7,516
Fairview, CA
Population 10,745
South San Francisco, CA
Population 64,305
Mountain View, CA
Population 83,732
Berkeley Demographics And Statistics
Population over time in Berkeley
The current population in Berkeley is 120,257. The population has increased 9.9% from 2010.
| Year | Population | % Change |
|---|---|---|
| 2024 | 120,257 | 0.0% |
| 2023 | 120,223 | -1.0% |
| 2022 | 121,385 | 1.5% |
| 2021 | 119,607 | -2.8% |
| 2020 | 123,065 | 1.3% |
| 2019 | 121,485 | 0.5% |
| 2018 | 120,926 | 0.6% |
| 2017 | 120,179 | 1.3% |
| 2016 | 118,585 | 1.0% |
| 2015 | 117,384 | 1.5% |
| 2014 | 115,688 | 1.4% |
| 2013 | 114,037 | 1.2% |
| 2012 | 112,662 | 1.5% |
| 2011 | 111,008 | 1.5% |
| 2010 | 109,408 | - |
Race / Ethnicity in Berkeley
See the full breakdown
Berkeley is:
49.9% White with 59,992 White residents.
7.7% African American with 9,284 African American residents.
0.1% American Indian with 100 American Indian residents.
20.4% Asian with 24,473 Asian residents.
0.1% Hawaiian with 137 Hawaiian residents.
1.1% Other with 1,276 Other residents.
8.0% Two Or More with 9,652 Two Or More residents.
12.8% Hispanic with 15,343 Hispanic residents.
| Race | Berkeley | CA | USA |
|---|---|---|---|
| White | 49.9% | 33.8% | 57.4% |
| African American | 7.7% | 5.2% | 11.9% |
| American Indian | 0.1% | 0.3% | 0.5% |
| Asian | 20.4% | 15.3% | 5.9% |
| Hawaiian | 0.1% | 0.3% | 0.2% |
| Other | 1.1% | 0.6% | 0.6% |
| Two Or More | 8.0% | 4.4% | 4.3% |
| Hispanic | 12.8% | 40.2% | 19.3% |
Gender in Berkeley
See the full breakdown
Berkeley is 51.9% female with 62,449 female residents.
Berkeley is 48.1% male with 57,807 male residents.
| Gender | Berkeley | CA | USA |
|---|---|---|---|
| Female | 51.9% | 50.1% | 50.5% |
| Male | 48.1% | 49.9% | 49.5% |
Highest level of educational attainment in Berkeley for adults over 25
See the full breakdown
1.0% of adults in Berkeley completed < 9th grade.
2.0% of adults in Berkeley completed 9-12th grade.
7.0% of adults in Berkeley completed high school / ged.
10.0% of adults in Berkeley completed some college.
4.0% of adults in Berkeley completed associate's degree.
33.0% of adults in Berkeley completed bachelor's degree.
24.0% of adults in Berkeley completed master's degree.
8.0% of adults in Berkeley completed professional degree.
11.0% of adults in Berkeley completed doctorate degree.
| Education | Berkeley | CA | USA |
|---|---|---|---|
| < 9th Grade | 1.0% | 8.0% | 4.0% |
| 9-12th Grade | 2.0% | 7.0% | 6.0% |
| High School / GED | 7.0% | 20.0% | 26.0% |
| Some College | 10.0% | 19.0% | 19.0% |
| Associate's Degree | 4.0% | 8.0% | 9.0% |
| Bachelor's Degree | 33.0% | 23.0% | 22.0% |
| Master's Degree | 24.0% | 10.0% | 10.0% |
| Professional Degree | 8.0% | 3.0% | 2.0% |
| Doctorate Degree | 11.0% | 2.0% | 2.0% |
Household Income For Berkeley, California
See the full breakdown
7.9% of households in Berkeley earn Less than $10,000.
3.0% of households in Berkeley earn $10,000 to $14,999.
5.4% of households in Berkeley earn $15,000 to $24,999.
4.5% of households in Berkeley earn $25,000 to $34,999.
7.5% of households in Berkeley earn $35,000 to $49,999.
11.5% of households in Berkeley earn $50,000 to $74,999.
8.1% of households in Berkeley earn $75,000 to $99,999.
12.4% of households in Berkeley earn $100,000 to $149,999.
9.1% of households in Berkeley earn $150,000 to $199,999.
30.7% of households in Berkeley earn $200,000 or more.
| Income | Berkeley | CA | USA |
|---|---|---|---|
| Less than $10,000 | 7.9% | 4.5% | 5.0% |
| $10,000 to $14,999 | 3.0% | 2.9% | 3.4% |
| $15,000 to $24,999 | 5.4% | 5.0% | 6.3% |
| $25,000 to $34,999 | 4.5% | 5.3% | 6.6% |
| $35,000 to $49,999 | 7.5% | 8.1% | 10.1% |
| $50,000 to $74,999 | 11.5% | 13.0% | 15.5% |
| $75,000 to $99,999 | 8.1% | 11.6% | 12.6% |
| $100,000 to $149,999 | 12.4% | 17.8% | 17.5% |
| $150,000 to $199,999 | 9.1% | 11.3% | 9.6% |
| $200,000 or more | 30.7% | 20.5% | 13.4% |
Source: U.S. Census ACS 5-year estimates (2024)


