Brawley SnackAbility
Overall SnackAbility
Crime in Brawley summary. We use data from the FBI to determine the crime rates in Brawley. Key points include:
There were 336 total crimes in Brawley in the last reporting year.
The overall crime rate per 100,000 people in Brawley is 1,186.8 / 100k people.
The violent crime rate per 100,000 people in Brawley is 296.7 / 100k people.
The property crime rate per 100,000 people in Brawley is 890.1 / 100k people.
Overall, crime in Brawley is -44.00% below the national average.
Total Crimes
Below National Average
Crime In Brawley Comparison Table
| Statistic | Count Raw |
Brawley / 100k People |
California / 100k People |
National / 100k People |
|---|---|---|---|---|
| Total Crimes Per 100K | 336 | 1,186.8 | 2,564.5 | 2,119.2 |
| Violent Crime | 84 | 296.7 | 486.0 | 359.0 |
| Murder | 0 | 0.0 | 4.5 | 5.0 |
| Robbery | 5 | 17.7 | 119.1 | 61.0 |
| Aggravated Assault | 77 | 272.0 | 325.8 | 256.0 |
| Property Crime | 252 | 890.1 | 2,078.4 | 1,760.0 |
| Burglary | 93 | 328.5 | 305.8 | 229.0 |
| Larceny | 133 | 469.8 | 1,345.2 | 1,272.0 |
| Car Theft | 26 | 91.8 | 427.5 | 259.0 |
Source: FBI Uniform Crime Reporting (2024)
Cost of living in Brawley summary. We use data on the cost of living to determine how expensive it is to live in Brawley. Real estate prices drive most of the variance in cost of living around California. Key points include:
The cost of living in Brawley is 113 with 100 being average.
The cost of living in Brawley is 1.1x higher than the national average.
The median home value in Brawley is $356,766.
The median income in Brawley is $59,311.
Brawley's Overall Cost Of Living
Higher Than The National Average
Cost Of Living In Brawley Comparison Table
| Living Expense | Brawley | California | National Average |
|---|---|---|---|
| Overall | 113 | 142 | 100 |
| Services | 111 | 110 | 100 |
| Groceries | 111 | 118 | 100 |
| Health | 109 | 197 | 100 |
| Housing | 114 | 120 | 100 |
| Transportation | 116 | 121 | 100 |
| Utilities | 115 | 121 | 100 |
Source: Cost of living index, normalized to US average = 100
Brawley, CA Weather
The average high in Brawley is 88.2° and the average low is 58.6°.
There are 11.6 days of precipitation each year.
Expect an average of 2.8 inches of precipitation each year with 0.0 inches of snow.
| Stat | Brawley |
|---|---|
| Average Annual High | 88.2 |
| Average Annual Low | 58.6 |
| Annual Precipitation Days | 11.6 |
| Average Annual Precipitation | 2.8 |
| Average Annual Snowfall | 0.0 |
Average High
Days of Rain
Source: NOAA climate normals (30-year)
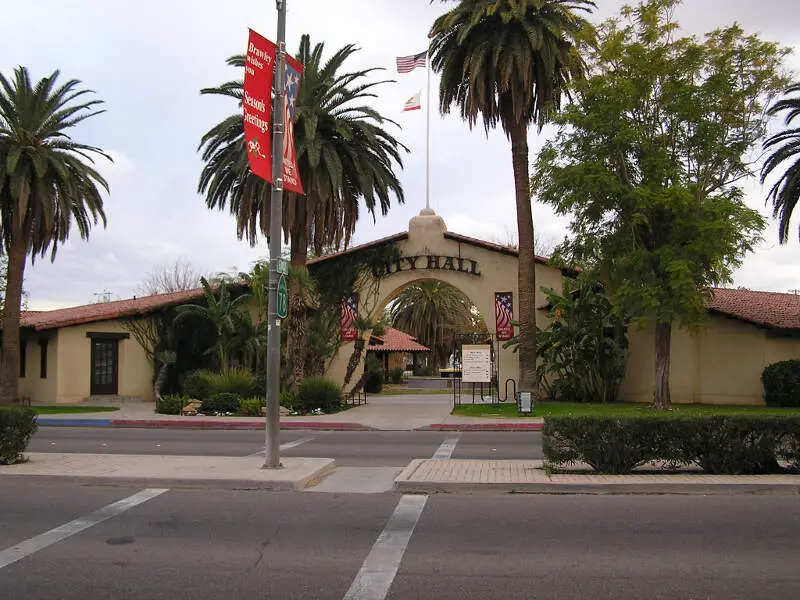
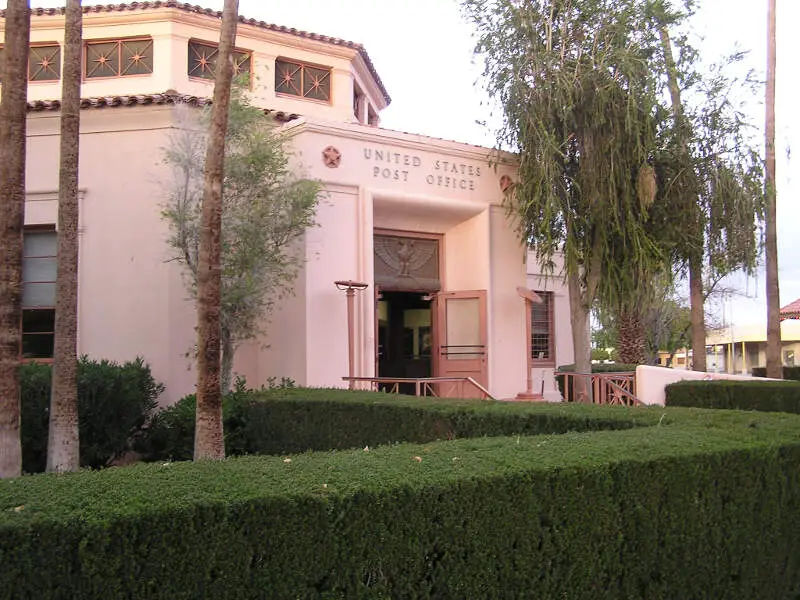
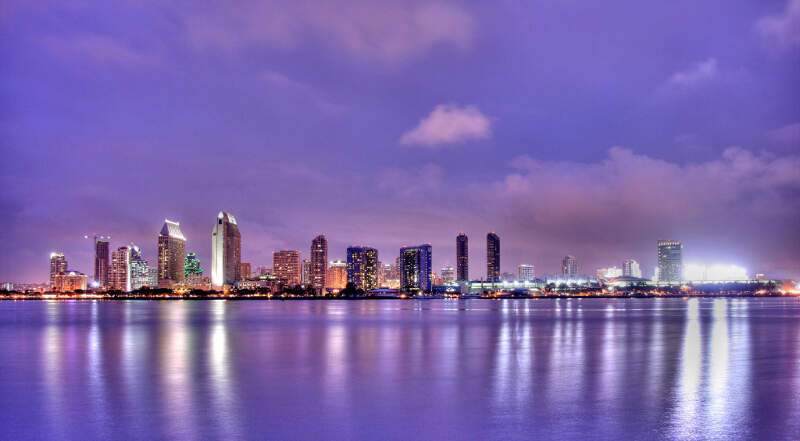
Brawley, CA Photos
Rankings & Articles For Brawley


Locations Around Brawley
Map Of Brawley, CA
Best Places Around Brawley
Imperial, CA
Population 21,430
Calipatria, CA
Population 6,548
Heber, CA
Population 7,312
El Centro, CA
Population 44,240
Holtville, CA
Population 5,617
Brawley Demographics And Statistics
Population over time in Brawley
The current population in Brawley is 27,283. The population has increased 12.3% from 2010.
| Year | Population | % Change |
|---|---|---|
| 2024 | 27,283 | 1.3% |
| 2023 | 26,934 | 1.6% |
| 2022 | 26,509 | 0.3% |
| 2021 | 26,431 | 1.9% |
| 2020 | 25,942 | -0.5% |
| 2019 | 26,076 | 0.3% |
| 2018 | 26,009 | 0.2% |
| 2017 | 25,959 | 0.7% |
| 2016 | 25,776 | 0.5% |
| 2015 | 25,656 | 0.7% |
| 2014 | 25,478 | 1.1% |
| 2013 | 25,191 | 0.9% |
| 2012 | 24,971 | 1.3% |
| 2011 | 24,645 | 1.5% |
| 2010 | 24,288 | - |
Race / Ethnicity in Brawley
See the full breakdown
Brawley is:
11.1% White with 3,030 White residents.
0.3% African American with 69 African American residents.
0.4% American Indian with 110 American Indian residents.
1.9% Asian with 511 Asian residents.
0.0% Hawaiian with 0 Hawaiian residents.
0.0% Other with 1 Other residents.
0.8% Two Or More with 211 Two Or More residents.
85.6% Hispanic with 23,351 Hispanic residents.
| Race | Brawley | CA | USA |
|---|---|---|---|
| White | 11.1% | 33.8% | 57.4% |
| African American | 0.3% | 5.2% | 11.9% |
| American Indian | 0.4% | 0.3% | 0.5% |
| Asian | 1.9% | 15.3% | 5.9% |
| Hawaiian | 0.0% | 0.3% | 0.2% |
| Other | 0.0% | 0.6% | 0.6% |
| Two Or More | 0.8% | 4.4% | 4.3% |
| Hispanic | 85.6% | 40.2% | 19.3% |
Gender in Brawley
See the full breakdown
Brawley is 48.5% female with 13,238 female residents.
Brawley is 51.5% male with 14,044 male residents.
| Gender | Brawley | CA | USA |
|---|---|---|---|
| Female | 48.5% | 50.1% | 50.5% |
| Male | 51.5% | 49.9% | 49.5% |
Highest level of educational attainment in Brawley for adults over 25
See the full breakdown
17.0% of adults in Brawley completed < 9th grade.
11.0% of adults in Brawley completed 9-12th grade.
26.0% of adults in Brawley completed high school / ged.
22.0% of adults in Brawley completed some college.
9.0% of adults in Brawley completed associate's degree.
12.0% of adults in Brawley completed bachelor's degree.
2.0% of adults in Brawley completed master's degree.
1.0% of adults in Brawley completed professional degree.
0.0% of adults in Brawley completed doctorate degree.
| Education | Brawley | CA | USA |
|---|---|---|---|
| < 9th Grade | 17.0% | 8.0% | 4.0% |
| 9-12th Grade | 11.0% | 7.0% | 6.0% |
| High School / GED | 26.0% | 20.0% | 26.0% |
| Some College | 22.0% | 19.0% | 19.0% |
| Associate's Degree | 9.0% | 8.0% | 9.0% |
| Bachelor's Degree | 12.0% | 23.0% | 22.0% |
| Master's Degree | 2.0% | 10.0% | 10.0% |
| Professional Degree | 1.0% | 3.0% | 2.0% |
| Doctorate Degree | 0.0% | 2.0% | 2.0% |
Household Income For Brawley, California
See the full breakdown
7.6% of households in Brawley earn Less than $10,000.
3.8% of households in Brawley earn $10,000 to $14,999.
11.9% of households in Brawley earn $15,000 to $24,999.
8.9% of households in Brawley earn $25,000 to $34,999.
10.7% of households in Brawley earn $35,000 to $49,999.
18.6% of households in Brawley earn $50,000 to $74,999.
9.9% of households in Brawley earn $75,000 to $99,999.
14.4% of households in Brawley earn $100,000 to $149,999.
7.2% of households in Brawley earn $150,000 to $199,999.
7.0% of households in Brawley earn $200,000 or more.
| Income | Brawley | CA | USA |
|---|---|---|---|
| Less than $10,000 | 7.6% | 4.5% | 5.0% |
| $10,000 to $14,999 | 3.8% | 2.9% | 3.4% |
| $15,000 to $24,999 | 11.9% | 5.0% | 6.3% |
| $25,000 to $34,999 | 8.9% | 5.3% | 6.6% |
| $35,000 to $49,999 | 10.7% | 8.1% | 10.1% |
| $50,000 to $74,999 | 18.6% | 13.0% | 15.5% |
| $75,000 to $99,999 | 9.9% | 11.6% | 12.6% |
| $100,000 to $149,999 | 14.4% | 17.8% | 17.5% |
| $150,000 to $199,999 | 7.2% | 11.3% | 9.6% |
| $200,000 or more | 7.0% | 20.5% | 13.4% |
Source: U.S. Census ACS 5-year estimates (2024)


