Calipatria SnackAbility
Overall SnackAbility
Cost of living in Calipatria summary. We use data on the cost of living to determine how expensive it is to live in Calipatria. Real estate prices drive most of the variance in cost of living around California. Key points include:
The cost of living in Calipatria is 101 with 100 being average.
The cost of living in Calipatria is 1.0x higher than the national average.
The median home value in Calipatria is $264,001.
The median income in Calipatria is $53,299.
Calipatria's Overall Cost Of Living
Higher Than The National Average
Cost Of Living In Calipatria Comparison Table
| Living Expense | Calipatria | California | National Average |
|---|---|---|---|
| Overall | 101 | 142 | 100 |
| Services | 110 | 110 | 100 |
| Groceries | 114 | 118 | 100 |
| Health | 80 | 197 | 100 |
| Housing | 114 | 120 | 100 |
| Transportation | 112 | 121 | 100 |
| Utilities | 117 | 121 | 100 |
Source: Cost of living index, normalized to US average = 100
Calipatria, CA Weather
The average high in Calipatria is 88.2° and the average low is 58.6°.
There are 11.6 days of precipitation each year.
Expect an average of 2.8 inches of precipitation each year with 0.0 inches of snow.
| Stat | Calipatria |
|---|---|
| Average Annual High | 88.2 |
| Average Annual Low | 58.6 |
| Annual Precipitation Days | 11.6 |
| Average Annual Precipitation | 2.8 |
| Average Annual Snowfall | 0.0 |
Average High
Days of Rain
Source: NOAA climate normals (30-year)
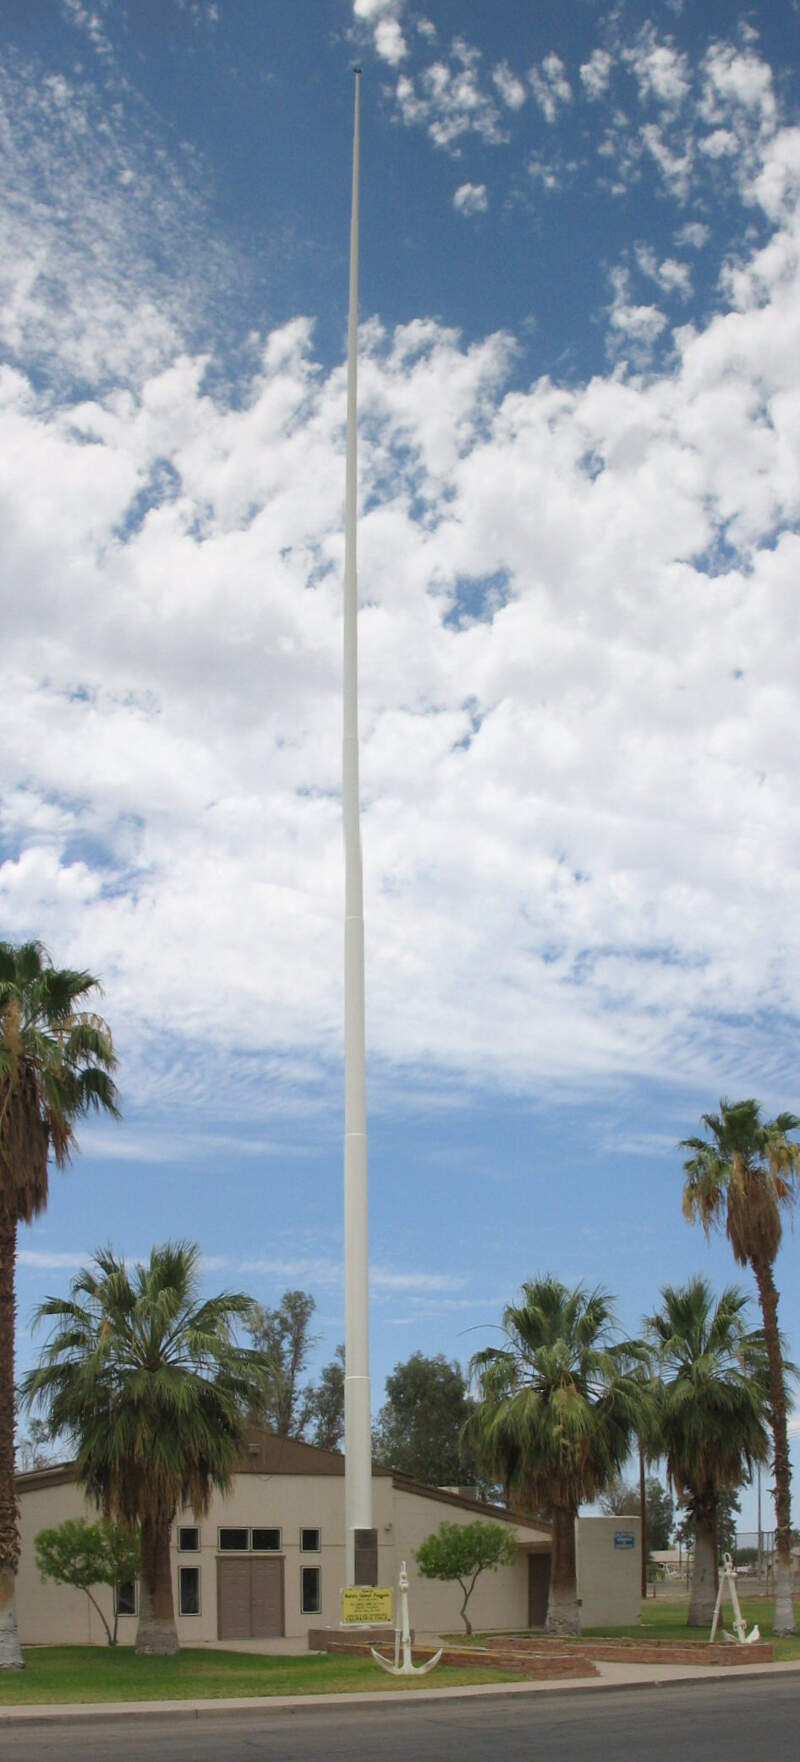
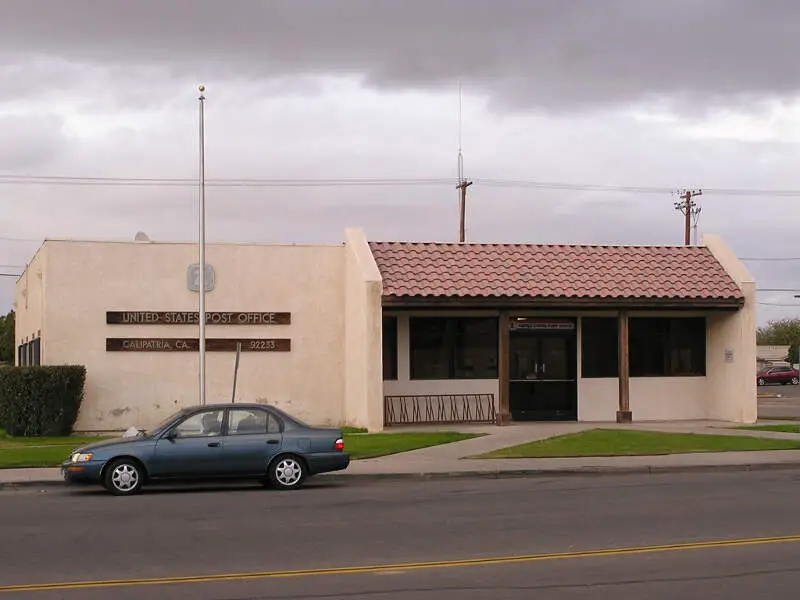
Calipatria, CA Photos

Rankings & Articles For Calipatria


Locations Around Calipatria
Map Of Calipatria, CA
Best Places Around Calipatria
Imperial, CA
Population 21,430
Calexico, CA
Population 38,585
Brawley, CA
Population 27,283
Heber, CA
Population 7,312
El Centro, CA
Population 44,240
Holtville, CA
Population 5,617
Calipatria Demographics And Statistics
Population over time in Calipatria
The current population in Calipatria is 6,548. The population has decreased 5.8% from 2010.
| Year | Population | % Change |
|---|---|---|
| 2024 | 6,548 | -0.0% |
| 2023 | 6,549 | -0.5% |
| 2022 | 6,579 | -9.2% |
| 2021 | 7,247 | -0.2% |
| 2020 | 7,260 | -1.8% |
| 2019 | 7,395 | -0.8% |
| 2018 | 7,458 | 0.4% |
| 2017 | 7,426 | -1.1% |
| 2016 | 7,511 | -0.6% |
| 2015 | 7,557 | -0.6% |
| 2014 | 7,599 | 0.3% |
| 2013 | 7,574 | 0.6% |
| 2012 | 7,532 | 3.3% |
| 2011 | 7,292 | 4.9% |
| 2010 | 6,953 | - |
Race / Ethnicity in Calipatria
See the full breakdown
Calipatria is:
6.8% White with 445 White residents.
8.7% African American with 568 African American residents.
0.7% American Indian with 46 American Indian residents.
0.2% Asian with 12 Asian residents.
0.2% Hawaiian with 10 Hawaiian residents.
0.2% Other with 13 Other residents.
0.8% Two Or More with 54 Two Or More residents.
82.5% Hispanic with 5,400 Hispanic residents.
| Race | Calipatria | CA | USA |
|---|---|---|---|
| White | 6.8% | 33.8% | 57.4% |
| African American | 8.7% | 5.2% | 11.9% |
| American Indian | 0.7% | 0.3% | 0.5% |
| Asian | 0.2% | 15.3% | 5.9% |
| Hawaiian | 0.2% | 0.3% | 0.2% |
| Other | 0.2% | 0.6% | 0.6% |
| Two Or More | 0.8% | 4.4% | 4.3% |
| Hispanic | 82.5% | 40.2% | 19.3% |
Gender in Calipatria
See the full breakdown
Calipatria is 32.2% female with 2,106 female residents.
Calipatria is 67.8% male with 4,441 male residents.
| Gender | Calipatria | CA | USA |
|---|---|---|---|
| Female | 32.2% | 50.1% | 50.5% |
| Male | 67.8% | 49.9% | 49.5% |
Highest level of educational attainment in Calipatria for adults over 25
See the full breakdown
12.0% of adults in Calipatria completed < 9th grade.
29.0% of adults in Calipatria completed 9-12th grade.
27.0% of adults in Calipatria completed high school / ged.
24.0% of adults in Calipatria completed some college.
4.0% of adults in Calipatria completed associate's degree.
2.0% of adults in Calipatria completed bachelor's degree.
1.0% of adults in Calipatria completed master's degree.
0.0% of adults in Calipatria completed professional degree.
1.0% of adults in Calipatria completed doctorate degree.
| Education | Calipatria | CA | USA |
|---|---|---|---|
| < 9th Grade | 12.0% | 8.0% | 4.0% |
| 9-12th Grade | 29.0% | 7.0% | 6.0% |
| High School / GED | 27.0% | 20.0% | 26.0% |
| Some College | 24.0% | 19.0% | 19.0% |
| Associate's Degree | 4.0% | 8.0% | 9.0% |
| Bachelor's Degree | 2.0% | 23.0% | 22.0% |
| Master's Degree | 1.0% | 10.0% | 10.0% |
| Professional Degree | 0.0% | 3.0% | 2.0% |
| Doctorate Degree | 1.0% | 2.0% | 2.0% |
Household Income For Calipatria, California
See the full breakdown
11.3% of households in Calipatria earn Less than $10,000.
6.3% of households in Calipatria earn $10,000 to $14,999.
4.2% of households in Calipatria earn $15,000 to $24,999.
13.1% of households in Calipatria earn $25,000 to $34,999.
11.5% of households in Calipatria earn $35,000 to $49,999.
25.4% of households in Calipatria earn $50,000 to $74,999.
13.2% of households in Calipatria earn $75,000 to $99,999.
10.2% of households in Calipatria earn $100,000 to $149,999.
2.0% of households in Calipatria earn $150,000 to $199,999.
2.7% of households in Calipatria earn $200,000 or more.
| Income | Calipatria | CA | USA |
|---|---|---|---|
| Less than $10,000 | 11.3% | 4.5% | 5.0% |
| $10,000 to $14,999 | 6.3% | 2.9% | 3.4% |
| $15,000 to $24,999 | 4.2% | 5.0% | 6.3% |
| $25,000 to $34,999 | 13.1% | 5.3% | 6.6% |
| $35,000 to $49,999 | 11.5% | 8.1% | 10.1% |
| $50,000 to $74,999 | 25.4% | 13.0% | 15.5% |
| $75,000 to $99,999 | 13.2% | 11.6% | 12.6% |
| $100,000 to $149,999 | 10.2% | 17.8% | 17.5% |
| $150,000 to $199,999 | 2.0% | 11.3% | 9.6% |
| $200,000 or more | 2.7% | 20.5% | 13.4% |
Source: U.S. Census ACS 5-year estimates (2024)


