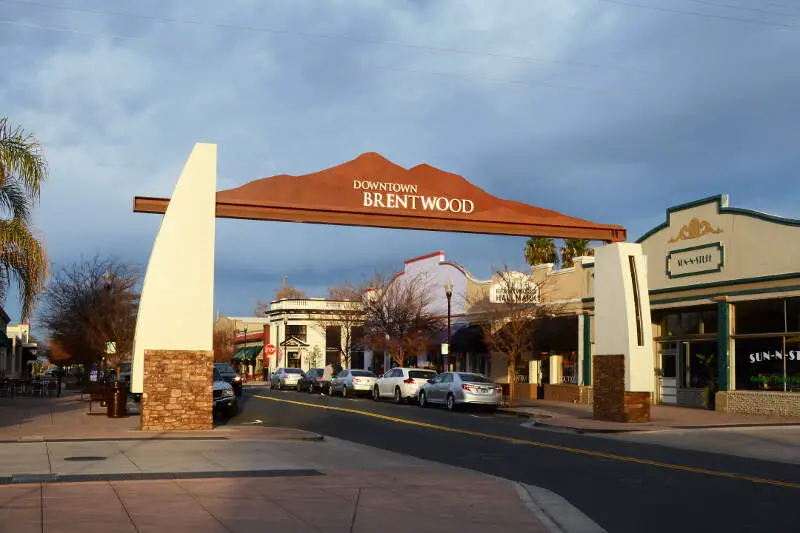
Brentwood, CA
Demographics And Statistics
Living In Brentwood, California Summary
Life in Brentwood research summary. HomeSnacks has been using Saturday Night Science to research the quality of life in Brentwood over the past nine years using Census, FBI, Zillow, and other primary data sources. Based on the most recently available data, we found the following about life in Brentwood:
The population in Brentwood is 64,609.
The median home value in Brentwood is $801,874.
The median income in Brentwood is $139,567.
The cost of living in Brentwood is 168 which is 1.7x higher than the national average.
The median rent in Brentwood is $2,509.
The unemployment rate in Brentwood is 6.0%.
The poverty rate in Brentwood is 7.8%.
The average high in Brentwood is 70.4° and the average low is 48.6°.
Brentwood SnackAbility
Overall SnackAbility
Brentwood, CA Crime Report
Crime in Brentwood summary. We use data from the FBI to determine the crime rates in Brentwood. Key points include:
There were 1,720 total crimes in Brentwood in the last reporting year.
The overall crime rate per 100,000 people in Brentwood is 2,631.9 / 100k people.
The violent crime rate per 100,000 people in Brentwood is 241.8 / 100k people.
The property crime rate per 100,000 people in Brentwood is 2,390.1 / 100k people.
Overall, crime in Brentwood is 24.19% above the national average.
Total Crimes
Above National Average
Crime In Brentwood Comparison Table
| Statistic | Count Raw |
Brentwood / 100k People |
California / 100k People |
National / 100k People |
|---|---|---|---|---|
| Total Crimes Per 100K | 1,720 | 2,631.9 | 2,564.5 | 2,119.2 |
| Violent Crime | 158 | 241.8 | 486.0 | 359.0 |
| Murder | 0 | 0.0 | 4.5 | 5.0 |
| Robbery | 59 | 90.3 | 119.1 | 61.0 |
| Aggravated Assault | 79 | 120.9 | 325.8 | 256.0 |
| Property Crime | 1,562 | 2,390.1 | 2,078.4 | 1,760.0 |
| Burglary | 144 | 220.3 | 305.8 | 229.0 |
| Larceny | 1,250 | 1,912.7 | 1,345.2 | 1,272.0 |
| Car Theft | 168 | 257.1 | 427.5 | 259.0 |
Brentwood, CA Cost Of Living
Cost of living in Brentwood summary. We use data on the cost of living to determine how expensive it is to live in Brentwood. Real estate prices drive most of the variance in cost of living around California. Key points include:
The cost of living in Brentwood is 168 with 100 being average.
The cost of living in Brentwood is 1.7x higher than the national average.
The median home value in Brentwood is $801,874.
The median income in Brentwood is $139,567.
Brentwood's Overall Cost Of Living
Higher Than The National Average
Cost Of Living In Brentwood Comparison Table
| Living Expense | Brentwood | California | National Average | |
|---|---|---|---|---|
| Overall | 168 | 141 | 100 | |
| Services | 109 | 110 | 100 | |
| Groceries | 106 | 112 | 100 | |
| Health | 104 | 110 | 100 | |
| Housing | 302 | 195 | 100 | |
| Transportation | 120 | 125 | 100 | |
| Utilities | 144 | 128 | 100 | |
Brentwood, CA Weather
The average high in Brentwood is 70.4° and the average low is 48.6°.
There are 41.7 days of precipitation each year.
Expect an average of 21.0 inches of precipitation each year with 0.2 inches of snow.
| Stat | Brentwood |
|---|---|
| Average Annual High | 70.4 |
| Average Annual Low | 48.6 |
| Annual Precipitation Days | 41.7 |
| Average Annual Precipitation | 21.0 |
| Average Annual Snowfall | 0.2 |
Average High
Days of Rain
Brentwood, CA Photos

Rankings for Brentwood in California


Locations Around Brentwood
Map Of Brentwood, CA
Best Places Around Brentwood
San Ramon, CA
Population 85,734
Dublin, CA
Population 70,542
Danville, CA
Population 43,426
Livermore, CA
Population 85,870
Blackhawk, CA
Population 10,404
Clayton, CA
Population 10,962
Pleasant Hill, CA
Population 34,335
Oakley, CA
Population 44,311
Alamo, CA
Population 14,441
Saranap, CA
Population 5,693
Brentwood Demographics And Statistics
Population over time in Brentwood
The current population in Brentwood is 64,609. The population has increased 39.6% from 2010.
| Year | Population | % Change |
|---|---|---|
| 2023 | 64,609 | 0.3% |
| 2022 | 64,443 | 1.3% |
| 2021 | 63,618 | 1.0% |
| 2020 | 63,013 | 1.7% |
| 2019 | 61,961 | 2.5% |
| 2018 | 60,446 | 2.8% |
| 2017 | 58,828 | 3.3% |
| 2016 | 56,923 | 2.6% |
| 2015 | 55,490 | 2.6% |
| 2014 | 54,062 | 3.0% |
| 2013 | 52,494 | 3.4% |
| 2012 | 50,764 | 4.5% |
| 2011 | 48,582 | 5.0% |
| 2010 | 46,283 | - |
Race / Ethnicity in Brentwood
Brentwood is:
43.0% White with 27,791 White residents.
9.4% African American with 6,098 African American residents.
0.3% American Indian with 177 American Indian residents.
16.5% Asian with 10,640 Asian residents.
0.3% Hawaiian with 224 Hawaiian residents.
0.9% Other with 587 Other residents.
4.8% Two Or More with 3,082 Two Or More residents.
24.8% Hispanic with 16,010 Hispanic residents.
| Race | Brentwood | CA | USA |
|---|---|---|---|
| White | 43.0% | 34.6% | 58.2% |
| African American | 9.4% | 5.3% | 12.0% |
| American Indian | 0.3% | 0.3% | 0.5% |
| Asian | 16.5% | 15.1% | 5.7% |
| Hawaiian | 0.3% | 0.3% | 0.2% |
| Other | 0.9% | 0.5% | 0.5% |
| Two Or More | 4.8% | 4.1% | 3.9% |
| Hispanic | 24.8% | 39.8% | 19.0% |
Gender in Brentwood
Brentwood is 51.1% female with 32,994 female residents.
Brentwood is 48.9% male with 31,615 male residents.
| Gender | Brentwood | CA | USA |
|---|---|---|---|
| Female | 51.1% | 50.0% | 50.5% |
| Male | 48.9% | 50.0% | 49.5% |
Highest level of educational attainment in Brentwood for adults over 25
3.0% of adults in Brentwood completed < 9th grade.
5.0% of adults in Brentwood completed 9-12th grade.
19.0% of adults in Brentwood completed high school / ged.
25.0% of adults in Brentwood completed some college.
9.0% of adults in Brentwood completed associate's degree.
26.0% of adults in Brentwood completed bachelor's degree.
10.0% of adults in Brentwood completed master's degree.
2.0% of adults in Brentwood completed professional degree.
1.0% of adults in Brentwood completed doctorate degree.
| Education | Brentwood | CA | USA |
|---|---|---|---|
| < 9th Grade | 3.0% | 8.0% | 5.0% |
| 9-12th Grade | 5.0% | 7.0% | 6.0% |
| High School / GED | 19.0% | 20.0% | 26.0% |
| Some College | 25.0% | 20.0% | 19.0% |
| Associate's Degree | 9.0% | 8.0% | 9.0% |
| Bachelor's Degree | 26.0% | 22.0% | 21.0% |
| Master's Degree | 10.0% | 10.0% | 10.0% |
| Professional Degree | 2.0% | 3.0% | 2.0% |
| Doctorate Degree | 1.0% | 2.0% | 2.0% |
Household Income For Brentwood, California
2.8% of households in Brentwood earn Less than $10,000.
1.6% of households in Brentwood earn $10,000 to $14,999.
3.4% of households in Brentwood earn $15,000 to $24,999.
2.9% of households in Brentwood earn $25,000 to $34,999.
5.1% of households in Brentwood earn $35,000 to $49,999.
8.6% of households in Brentwood earn $50,000 to $74,999.
10.1% of households in Brentwood earn $75,000 to $99,999.
19.2% of households in Brentwood earn $100,000 to $149,999.
16.5% of households in Brentwood earn $150,000 to $199,999.
29.8% of households in Brentwood earn $200,000 or more.
| Income | Brentwood | CA | USA |
|---|---|---|---|
| Less than $10,000 | 2.8% | 4.4% | 4.9% |
| $10,000 to $14,999 | 1.6% | 3.0% | 3.6% |
| $15,000 to $24,999 | 3.4% | 5.2% | 6.6% |
| $25,000 to $34,999 | 2.9% | 5.5% | 6.8% |
| $35,000 to $49,999 | 5.1% | 8.4% | 10.4% |
| $50,000 to $74,999 | 8.6% | 13.3% | 15.7% |
| $75,000 to $99,999 | 10.1% | 11.8% | 12.7% |
| $100,000 to $149,999 | 19.2% | 17.9% | 17.4% |
| $150,000 to $199,999 | 16.5% | 11.1% | 9.3% |
| $200,000 or more | 29.8% | 19.4% | 12.6% |


