Livermore SnackAbility
Overall SnackAbility
Crime in Livermore summary. We use data from the FBI to determine the crime rates in Livermore. Key points include:
There were 2,082 total crimes in Livermore in the last reporting year.
The overall crime rate per 100,000 people in Livermore is 2,560.4 / 100k people.
The violent crime rate per 100,000 people in Livermore is 234.9 / 100k people.
The property crime rate per 100,000 people in Livermore is 2,325.5 / 100k people.
Overall, crime in Livermore is 20.82% above the national average.
Total Crimes
Above National Average
Crime In Livermore Comparison Table
| Statistic | Count Raw |
Livermore / 100k People |
California / 100k People |
National / 100k People |
|---|---|---|---|---|
| Total Crimes Per 100K | 2,082 | 2,560.4 | 2,564.5 | 2,119.2 |
| Violent Crime | 191 | 234.9 | 486.0 | 359.0 |
| Murder | 3 | 3.7 | 4.5 | 5.0 |
| Robbery | 40 | 49.2 | 119.1 | 61.0 |
| Aggravated Assault | 121 | 148.8 | 325.8 | 256.0 |
| Property Crime | 1,891 | 2,325.5 | 2,078.4 | 1,760.0 |
| Burglary | 236 | 290.2 | 305.8 | 229.0 |
| Larceny | 1,342 | 1,650.4 | 1,345.2 | 1,272.0 |
| Car Theft | 313 | 384.9 | 427.5 | 259.0 |
Source: FBI Uniform Crime Reporting (2024)
Cost of living in Livermore summary. We use data on the cost of living to determine how expensive it is to live in Livermore. Real estate prices drive most of the variance in cost of living around California. Key points include:
The cost of living in Livermore is 199 with 100 being average.
The cost of living in Livermore is 2.0x higher than the national average.
The median home value in Livermore is $1,122,822.
The median income in Livermore is $160,775.
Livermore's Overall Cost Of Living
Higher Than The National Average
Cost Of Living In Livermore Comparison Table
| Living Expense | Livermore | California | National Average |
|---|---|---|---|
| Overall | 199 | 142 | 100 |
| Services | 114 | 110 | 100 |
| Groceries | 119 | 118 | 100 |
| Health | 378 | 197 | 100 |
| Housing | 124 | 120 | 100 |
| Transportation | 124 | 121 | 100 |
| Utilities | 122 | 121 | 100 |
Source: Cost of living index, normalized to US average = 100
Livermore, CA Weather
The average high in Livermore is 67.8° and the average low is 49.9°.
There are 42.8 days of precipitation each year.
Expect an average of 21.8 inches of precipitation each year with 0.0 inches of snow.
| Stat | Livermore |
|---|---|
| Average Annual High | 67.8 |
| Average Annual Low | 49.9 |
| Annual Precipitation Days | 42.8 |
| Average Annual Precipitation | 21.8 |
| Average Annual Snowfall | 0.0 |
Average High
Days of Rain
Source: NOAA climate normals (30-year)
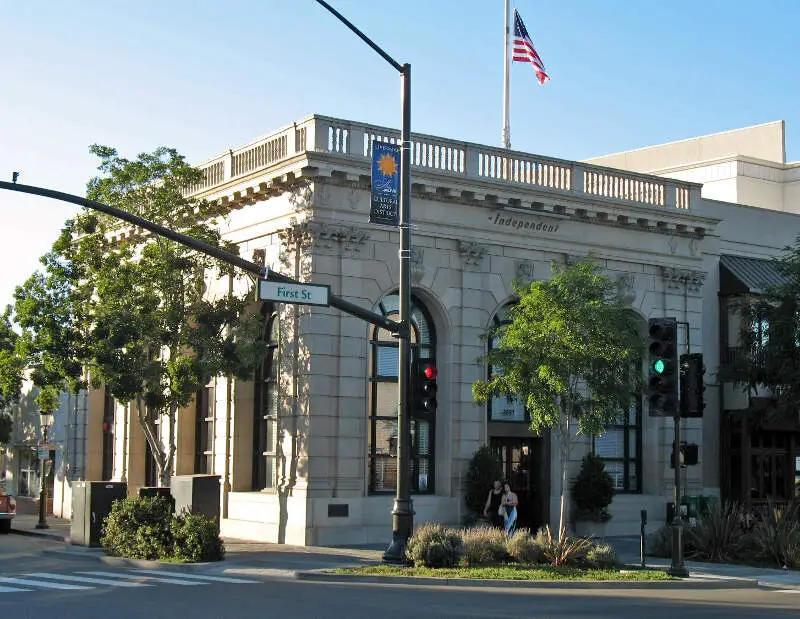
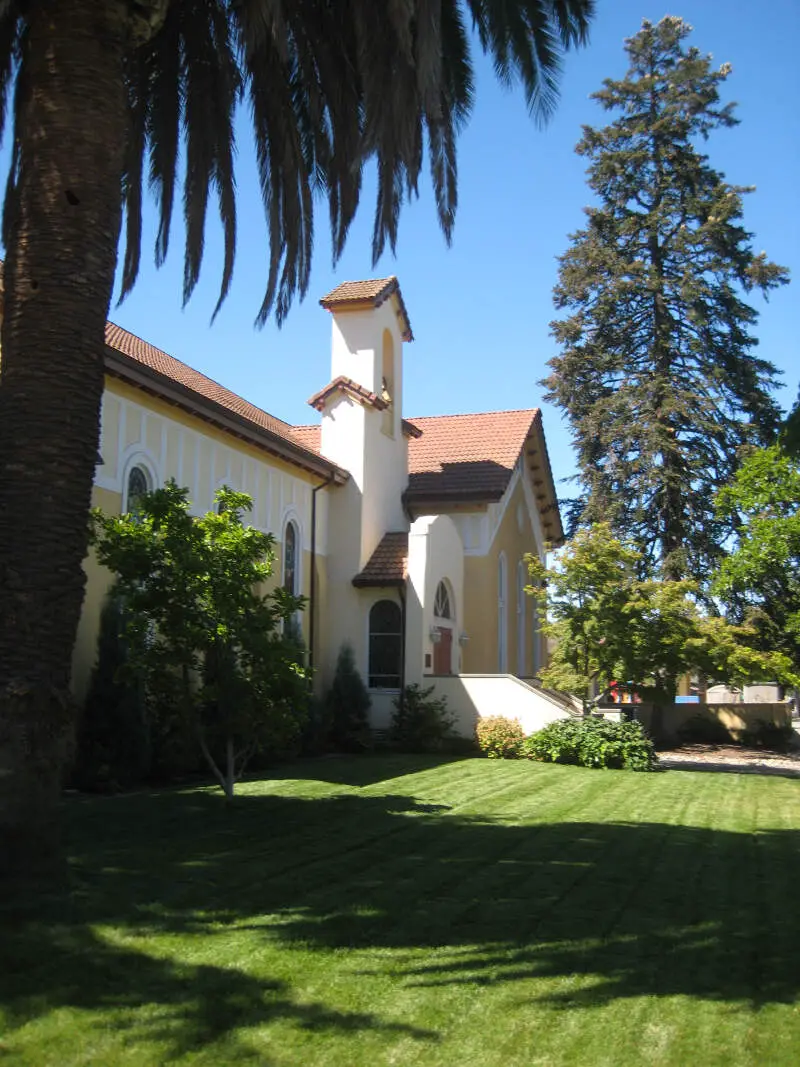
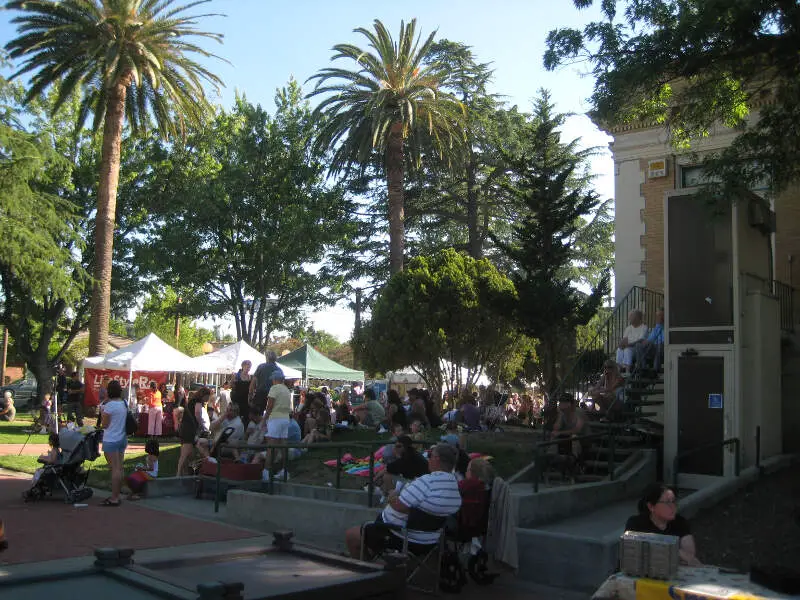
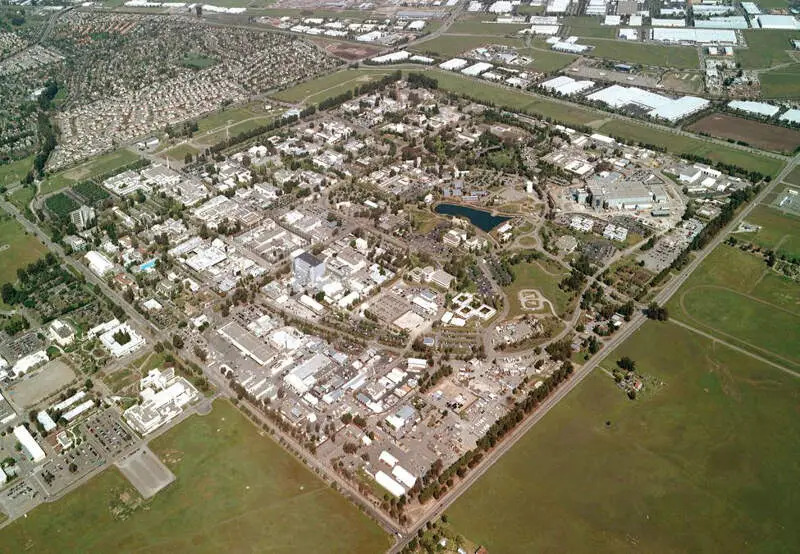
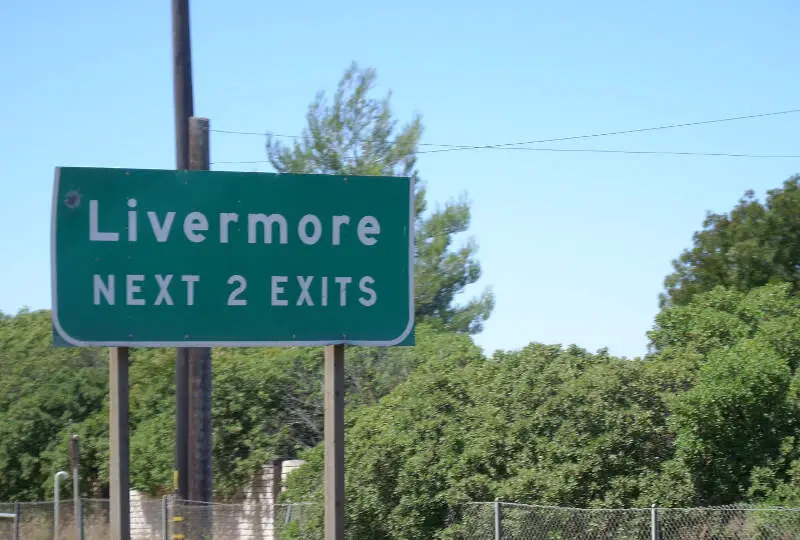
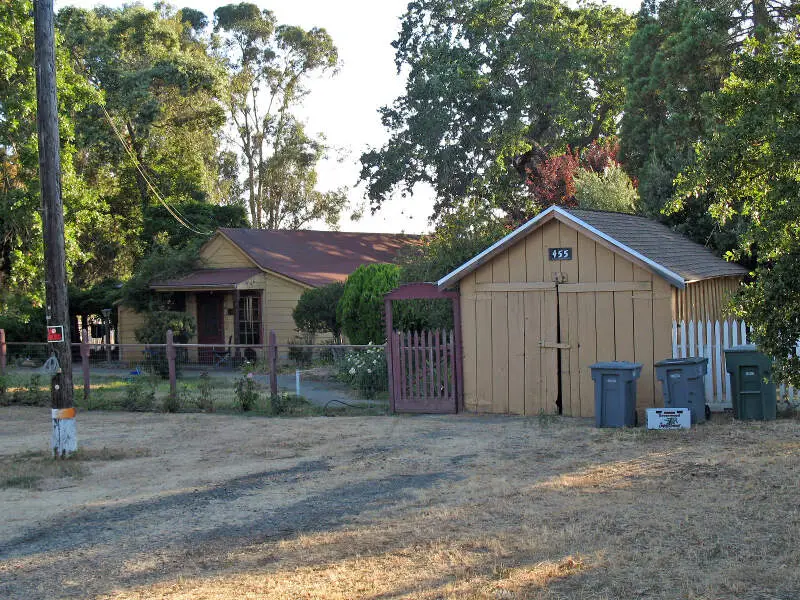
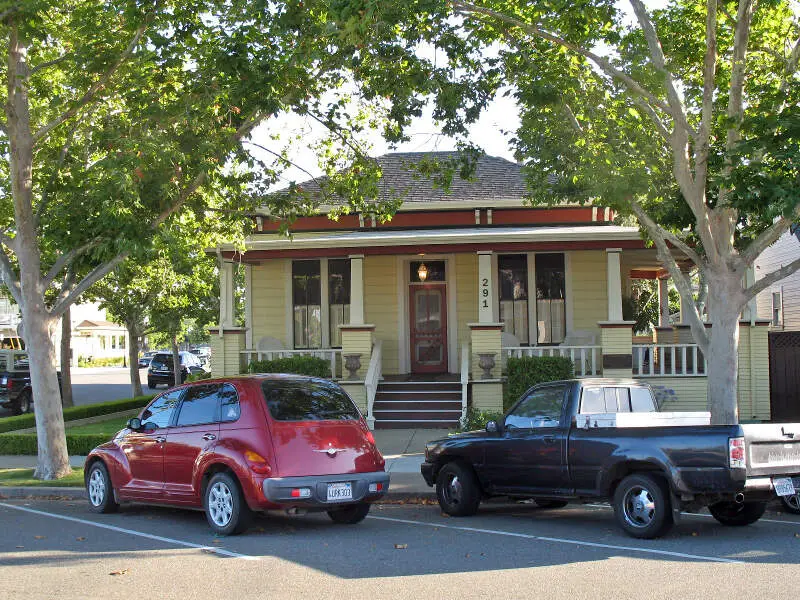
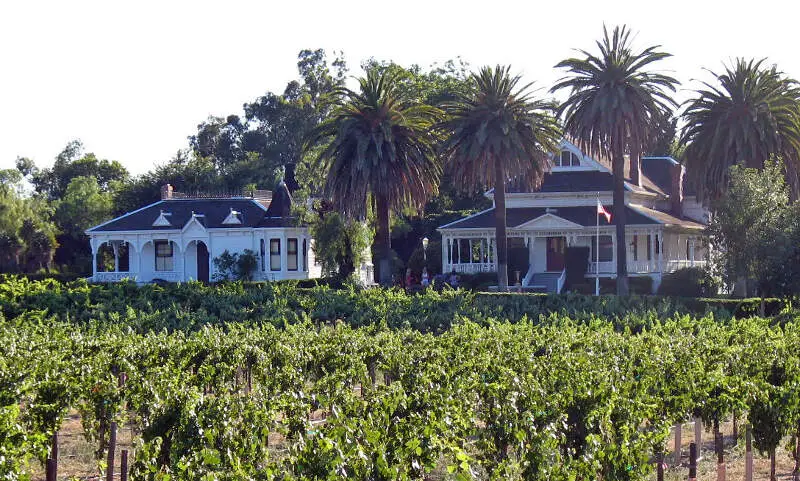
Livermore, CA Photos

1 Reviews & Comments About Livermore

I lived in Livermore for 35+ years, and there is in NO WAY why this place should be considered. There's far worse places in California that I've lived in, or visited that make Livermore look like Beverly Hills.
Rankings & Articles For Livermore


Locations Around Livermore
Map Of Livermore, CA
Best Places Around Livermore
San Ramon, CA
Population 85,993
Pleasanton, CA
Population 76,960
Fairview, CA
Population 10,745
Dublin, CA
Population 70,803
Danville, CA
Population 43,401
Milpitas, CA
Population 78,578
Blackhawk, CA
Population 10,137
Clayton, CA
Population 10,937
Newark, CA
Population 46,903
Castro Valley, CA
Population 65,001
Livermore Demographics And Statistics
Population over time in Livermore
The current population in Livermore is 85,522. The population has increased 8.9% from 2010.
| Year | Population | % Change |
|---|---|---|
| 2024 | 85,522 | -0.4% |
| 2023 | 85,870 | -1.5% |
| 2022 | 87,154 | -1.4% |
| 2021 | 88,403 | -3.7% |
| 2020 | 91,763 | 2.3% |
| 2019 | 89,699 | 0.8% |
| 2018 | 89,027 | 0.9% |
| 2017 | 88,232 | 2.0% |
| 2016 | 86,493 | 1.4% |
| 2015 | 85,286 | 1.7% |
| 2014 | 83,901 | 1.8% |
| 2013 | 82,442 | 1.7% |
| 2012 | 81,086 | 1.7% |
| 2011 | 79,710 | 1.5% |
| 2010 | 78,520 | - |
Race / Ethnicity in Livermore
See the full breakdown
Livermore is:
52.5% White with 44,884 White residents.
2.0% African American with 1,694 African American residents.
0.1% American Indian with 67 American Indian residents.
17.0% Asian with 14,581 Asian residents.
0.4% Hawaiian with 319 Hawaiian residents.
0.3% Other with 243 Other residents.
5.9% Two Or More with 5,018 Two Or More residents.
21.9% Hispanic with 18,716 Hispanic residents.
| Race | Livermore | CA | USA |
|---|---|---|---|
| White | 52.5% | 33.8% | 57.4% |
| African American | 2.0% | 5.2% | 11.9% |
| American Indian | 0.1% | 0.3% | 0.5% |
| Asian | 17.0% | 15.3% | 5.9% |
| Hawaiian | 0.4% | 0.3% | 0.2% |
| Other | 0.3% | 0.6% | 0.6% |
| Two Or More | 5.9% | 4.4% | 4.3% |
| Hispanic | 21.9% | 40.2% | 19.3% |
Gender in Livermore
See the full breakdown
Livermore is 49.9% female with 42,690 female residents.
Livermore is 50.1% male with 42,832 male residents.
| Gender | Livermore | CA | USA |
|---|---|---|---|
| Female | 49.9% | 50.1% | 50.5% |
| Male | 50.1% | 49.9% | 49.5% |
Highest level of educational attainment in Livermore for adults over 25
See the full breakdown
3.0% of adults in Livermore completed < 9th grade.
3.0% of adults in Livermore completed 9-12th grade.
13.0% of adults in Livermore completed high school / ged.
20.0% of adults in Livermore completed some college.
9.0% of adults in Livermore completed associate's degree.
31.0% of adults in Livermore completed bachelor's degree.
15.0% of adults in Livermore completed master's degree.
2.0% of adults in Livermore completed professional degree.
4.0% of adults in Livermore completed doctorate degree.
| Education | Livermore | CA | USA |
|---|---|---|---|
| < 9th Grade | 3.0% | 8.0% | 4.0% |
| 9-12th Grade | 3.0% | 7.0% | 6.0% |
| High School / GED | 13.0% | 20.0% | 26.0% |
| Some College | 20.0% | 19.0% | 19.0% |
| Associate's Degree | 9.0% | 8.0% | 9.0% |
| Bachelor's Degree | 31.0% | 23.0% | 22.0% |
| Master's Degree | 15.0% | 10.0% | 10.0% |
| Professional Degree | 2.0% | 3.0% | 2.0% |
| Doctorate Degree | 4.0% | 2.0% | 2.0% |
Household Income For Livermore, California
See the full breakdown
2.9% of households in Livermore earn Less than $10,000.
1.5% of households in Livermore earn $10,000 to $14,999.
2.6% of households in Livermore earn $15,000 to $24,999.
2.9% of households in Livermore earn $25,000 to $34,999.
4.7% of households in Livermore earn $35,000 to $49,999.
7.6% of households in Livermore earn $50,000 to $74,999.
8.4% of households in Livermore earn $75,000 to $99,999.
15.9% of households in Livermore earn $100,000 to $149,999.
13.6% of households in Livermore earn $150,000 to $199,999.
39.8% of households in Livermore earn $200,000 or more.
| Income | Livermore | CA | USA |
|---|---|---|---|
| Less than $10,000 | 2.9% | 4.5% | 5.0% |
| $10,000 to $14,999 | 1.5% | 2.9% | 3.4% |
| $15,000 to $24,999 | 2.6% | 5.0% | 6.3% |
| $25,000 to $34,999 | 2.9% | 5.3% | 6.6% |
| $35,000 to $49,999 | 4.7% | 8.1% | 10.1% |
| $50,000 to $74,999 | 7.6% | 13.0% | 15.5% |
| $75,000 to $99,999 | 8.4% | 11.6% | 12.6% |
| $100,000 to $149,999 | 15.9% | 17.8% | 17.5% |
| $150,000 to $199,999 | 13.6% | 11.3% | 9.6% |
| $200,000 or more | 39.8% | 20.5% | 13.4% |
Source: U.S. Census ACS 5-year estimates (2024)


