Citrus Heights SnackAbility
Overall SnackAbility
Crime in Citrus Heights summary. We use data from the FBI to determine the crime rates in Citrus Heights. Key points include:
There were 2,202 total crimes in Citrus Heights in the last reporting year.
The overall crime rate per 100,000 people in Citrus Heights is 2,566.2 / 100k people.
The violent crime rate per 100,000 people in Citrus Heights is 439.3 / 100k people.
The property crime rate per 100,000 people in Citrus Heights is 2,126.8 / 100k people.
Overall, crime in Citrus Heights is 21.09% above the national average.
Total Crimes
Above National Average
Crime In Citrus Heights Comparison Table
| Statistic | Count Raw |
Citrus Heights / 100k People |
California / 100k People |
National / 100k People |
|---|---|---|---|---|
| Total Crimes Per 100K | 2,202 | 2,566.2 | 2,564.5 | 2,119.2 |
| Violent Crime | 377 | 439.3 | 486.0 | 359.0 |
| Murder | 3 | 3.5 | 4.5 | 5.0 |
| Robbery | 82 | 95.6 | 119.1 | 61.0 |
| Aggravated Assault | 259 | 301.8 | 325.8 | 256.0 |
| Property Crime | 1,825 | 2,126.8 | 2,078.4 | 1,760.0 |
| Burglary | 317 | 369.4 | 305.8 | 229.0 |
| Larceny | 1,265 | 1,474.2 | 1,345.2 | 1,272.0 |
| Car Theft | 243 | 283.2 | 427.5 | 259.0 |
Source: FBI Uniform Crime Reporting (2024)
Cost of living in Citrus Heights summary. We use data on the cost of living to determine how expensive it is to live in Citrus Heights. Real estate prices drive most of the variance in cost of living around California. Key points include:
The cost of living in Citrus Heights is 133 with 100 being average.
The cost of living in Citrus Heights is 1.3x higher than the national average.
The median home value in Citrus Heights is $477,113.
The median income in Citrus Heights is $82,314.
Citrus Heights's Overall Cost Of Living
Higher Than The National Average
Cost Of Living In Citrus Heights Comparison Table
| Living Expense | Citrus Heights | California | National Average |
|---|---|---|---|
| Overall | 133 | 142 | 100 |
| Services | 110 | 110 | 100 |
| Groceries | 120 | 118 | 100 |
| Health | 166 | 197 | 100 |
| Housing | 116 | 120 | 100 |
| Transportation | 120 | 121 | 100 |
| Utilities | 116 | 121 | 100 |
Source: Cost of living index, normalized to US average = 100
Citrus Heights, CA Weather
The average high in Citrus Heights is 74.3° and the average low is 49.0°.
There are 41.4 days of precipitation each year.
Expect an average of 20.3 inches of precipitation each year with 0.0 inches of snow.
| Stat | Citrus Heights |
|---|---|
| Average Annual High | 74.3 |
| Average Annual Low | 49.0 |
| Annual Precipitation Days | 41.4 |
| Average Annual Precipitation | 20.3 |
| Average Annual Snowfall | 0.0 |
Average High
Days of Rain
Source: NOAA climate normals (30-year)
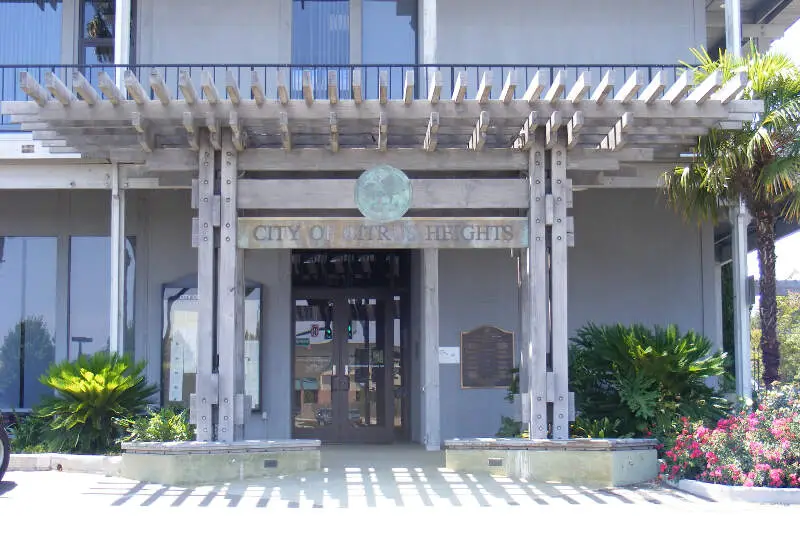
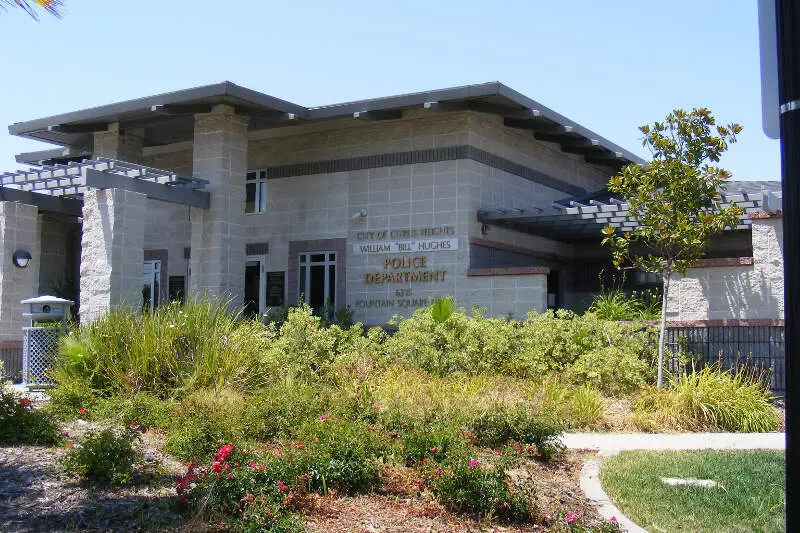
Citrus Heights, CA Photos
Rankings & Articles For Citrus Heights


Locations Around Citrus Heights
Map Of Citrus Heights, CA
Best Places Around Citrus Heights
Gold River, CA
Population 7,924
Folsom, CA
Population 83,916
Rocklin, CA
Population 73,327
Orangevale, CA
Population 35,958
Granite Bay, CA
Population 21,673
El Dorado Hills, CA
Population 51,026
La Riviera, CA
Population 11,492
Fair Oaks, CA
Population 32,799
Antelope, CA
Population 48,301
Vineyard, CA
Population 43,751
Citrus Heights Demographics And Statistics
Population over time in Citrus Heights
The current population in Citrus Heights is 86,995. The population has increased 3.1% from 2010.
| Year | Population | % Change |
|---|---|---|
| 2024 | 86,995 | -0.0% |
| 2023 | 87,036 | -0.1% |
| 2022 | 87,127 | -0.5% |
| 2021 | 87,521 | -0.2% |
| 2020 | 87,665 | 0.3% |
| 2019 | 87,373 | 0.4% |
| 2018 | 87,061 | 0.5% |
| 2017 | 86,618 | 0.8% |
| 2016 | 85,954 | 0.6% |
| 2015 | 85,408 | 0.9% |
| 2014 | 84,678 | 0.5% |
| 2013 | 84,218 | 0.1% |
| 2012 | 84,104 | -0.0% |
| 2011 | 84,112 | -0.3% |
| 2010 | 84,351 | - |
Race / Ethnicity in Citrus Heights
See the full breakdown
Citrus Heights is:
65.6% White with 57,059 White residents.
3.5% African American with 3,081 African American residents.
0.3% American Indian with 285 American Indian residents.
3.5% Asian with 3,069 Asian residents.
0.2% Hawaiian with 169 Hawaiian residents.
0.5% Other with 395 Other residents.
6.2% Two Or More with 5,434 Two Or More residents.
20.1% Hispanic with 17,503 Hispanic residents.
| Race | Citrus Heights | CA | USA |
|---|---|---|---|
| White | 65.6% | 33.8% | 57.4% |
| African American | 3.5% | 5.2% | 11.9% |
| American Indian | 0.3% | 0.3% | 0.5% |
| Asian | 3.5% | 15.3% | 5.9% |
| Hawaiian | 0.2% | 0.3% | 0.2% |
| Other | 0.5% | 0.6% | 0.6% |
| Two Or More | 6.2% | 4.4% | 4.3% |
| Hispanic | 20.1% | 40.2% | 19.3% |
Gender in Citrus Heights
See the full breakdown
Citrus Heights is 51.6% female with 44,925 female residents.
Citrus Heights is 48.4% male with 42,069 male residents.
| Gender | Citrus Heights | CA | USA |
|---|---|---|---|
| Female | 51.6% | 50.1% | 50.5% |
| Male | 48.4% | 49.9% | 49.5% |
Highest level of educational attainment in Citrus Heights for adults over 25
See the full breakdown
5.0% of adults in Citrus Heights completed < 9th grade.
5.0% of adults in Citrus Heights completed 9-12th grade.
26.0% of adults in Citrus Heights completed high school / ged.
30.0% of adults in Citrus Heights completed some college.
11.0% of adults in Citrus Heights completed associate's degree.
16.0% of adults in Citrus Heights completed bachelor's degree.
5.0% of adults in Citrus Heights completed master's degree.
1.0% of adults in Citrus Heights completed professional degree.
1.0% of adults in Citrus Heights completed doctorate degree.
| Education | Citrus Heights | CA | USA |
|---|---|---|---|
| < 9th Grade | 5.0% | 8.0% | 4.0% |
| 9-12th Grade | 5.0% | 7.0% | 6.0% |
| High School / GED | 26.0% | 20.0% | 26.0% |
| Some College | 30.0% | 19.0% | 19.0% |
| Associate's Degree | 11.0% | 8.0% | 9.0% |
| Bachelor's Degree | 16.0% | 23.0% | 22.0% |
| Master's Degree | 5.0% | 10.0% | 10.0% |
| Professional Degree | 1.0% | 3.0% | 2.0% |
| Doctorate Degree | 1.0% | 2.0% | 2.0% |
Household Income For Citrus Heights, California
See the full breakdown
3.7% of households in Citrus Heights earn Less than $10,000.
2.3% of households in Citrus Heights earn $10,000 to $14,999.
4.3% of households in Citrus Heights earn $15,000 to $24,999.
6.2% of households in Citrus Heights earn $25,000 to $34,999.
11.1% of households in Citrus Heights earn $35,000 to $49,999.
17.5% of households in Citrus Heights earn $50,000 to $74,999.
15.9% of households in Citrus Heights earn $75,000 to $99,999.
21.6% of households in Citrus Heights earn $100,000 to $149,999.
9.5% of households in Citrus Heights earn $150,000 to $199,999.
7.8% of households in Citrus Heights earn $200,000 or more.
| Income | Citrus Heights | CA | USA |
|---|---|---|---|
| Less than $10,000 | 3.7% | 4.5% | 5.0% |
| $10,000 to $14,999 | 2.3% | 2.9% | 3.4% |
| $15,000 to $24,999 | 4.3% | 5.0% | 6.3% |
| $25,000 to $34,999 | 6.2% | 5.3% | 6.6% |
| $35,000 to $49,999 | 11.1% | 8.1% | 10.1% |
| $50,000 to $74,999 | 17.5% | 13.0% | 15.5% |
| $75,000 to $99,999 | 15.9% | 11.6% | 12.6% |
| $100,000 to $149,999 | 21.6% | 17.8% | 17.5% |
| $150,000 to $199,999 | 9.5% | 11.3% | 9.6% |
| $200,000 or more | 7.8% | 20.5% | 13.4% |
Source: U.S. Census ACS 5-year estimates (2024)


