Escondido SnackAbility
Overall SnackAbility
Crime in Escondido summary. We use data from the FBI to determine the crime rates in Escondido. Key points include:
There were 2,824 total crimes in Escondido in the last reporting year.
The overall crime rate per 100,000 people in Escondido is 1,918.9 / 100k people.
The violent crime rate per 100,000 people in Escondido is 433.5 / 100k people.
The property crime rate per 100,000 people in Escondido is 1,485.4 / 100k people.
Overall, crime in Escondido is -9.45% below the national average.
Total Crimes
Below National Average
Crime In Escondido Comparison Table
| Statistic | Count Raw |
Escondido / 100k People |
California / 100k People |
National / 100k People |
|---|---|---|---|---|
| Total Crimes Per 100K | 2,824 | 1,918.9 | 2,564.5 | 2,119.2 |
| Violent Crime | 638 | 433.5 | 486.0 | 359.0 |
| Murder | 2 | 1.4 | 4.5 | 5.0 |
| Robbery | 165 | 112.1 | 119.1 | 61.0 |
| Aggravated Assault | 445 | 302.4 | 325.8 | 256.0 |
| Property Crime | 2,186 | 1,485.4 | 2,078.4 | 1,760.0 |
| Burglary | 328 | 222.9 | 305.8 | 229.0 |
| Larceny | 1,546 | 1,050.5 | 1,345.2 | 1,272.0 |
| Car Theft | 312 | 212.0 | 427.5 | 259.0 |
Source: FBI Uniform Crime Reporting (2024)
Cost of living in Escondido summary. We use data on the cost of living to determine how expensive it is to live in Escondido. Real estate prices drive most of the variance in cost of living around California. Key points include:
The cost of living in Escondido is 152 with 100 being average.
The cost of living in Escondido is 1.5x higher than the national average.
The median home value in Escondido is $844,072.
The median income in Escondido is $91,967.
Escondido's Overall Cost Of Living
Higher Than The National Average
Cost Of Living In Escondido Comparison Table
| Living Expense | Escondido | California | National Average |
|---|---|---|---|
| Overall | 152 | 142 | 100 |
| Services | 108 | 110 | 100 |
| Groceries | 116 | 118 | 100 |
| Health | 226 | 197 | 100 |
| Housing | 117 | 120 | 100 |
| Transportation | 119 | 121 | 100 |
| Utilities | 124 | 121 | 100 |
Source: Cost of living index, normalized to US average = 100
Escondido, CA Weather
The average high in Escondido is 73.0° and the average low is 51.8°.
There are 24.3 days of precipitation each year.
Expect an average of 13.2 inches of precipitation each year with 1.2 inches of snow.
| Stat | Escondido |
|---|---|
| Average Annual High | 73.0 |
| Average Annual Low | 51.8 |
| Annual Precipitation Days | 24.3 |
| Average Annual Precipitation | 13.2 |
| Average Annual Snowfall | 1.2 |
Average High
Days of Rain
Source: NOAA climate normals (30-year)
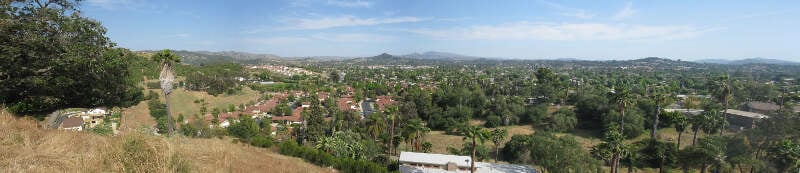
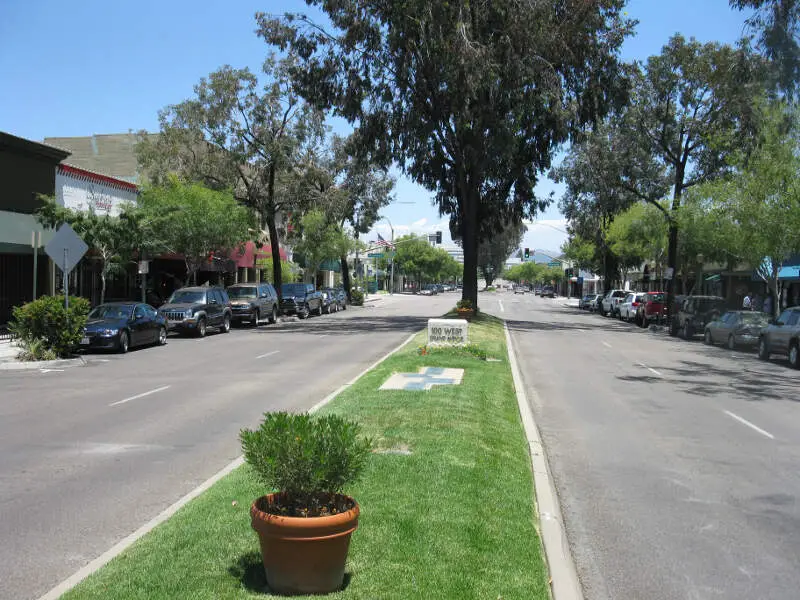
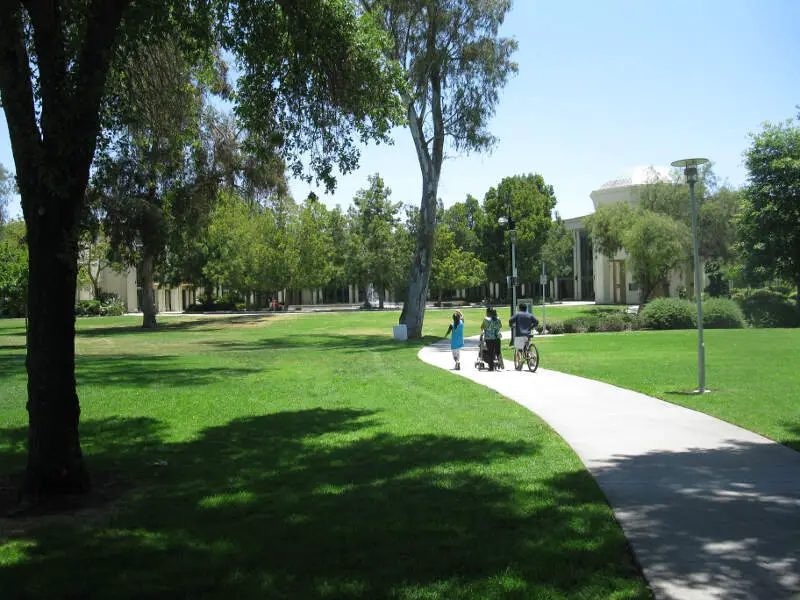
Escondido, CA Photos


Rankings & Articles For Escondido


Locations Around Escondido
Map Of Escondido, CA
Best Places Around Escondido
Santee, CA
Population 59,332
Poway, CA
Population 48,713
Encinitas, CA
Population 61,480
Carlsbad, CA
Population 114,373
San Diego Country Estates, CA
Population 10,223
San Marcos, CA
Population 94,882
Camp Pendleton South, CA
Population 15,766
Solana Beach, CA
Population 12,823
Oceanside, CA
Population 172,242
Eucalyptus Hills, CA
Population 5,840
Escondido Demographics And Statistics
Population over time in Escondido
The current population in Escondido is 149,668. The population has increased 6.1% from 2010.
| Year | Population | % Change |
|---|---|---|
| 2024 | 149,668 | -0.2% |
| 2023 | 149,913 | -0.8% |
| 2022 | 151,114 | -0.2% |
| 2021 | 151,443 | 0.7% |
| 2020 | 150,396 | -0.6% |
| 2019 | 151,300 | 0.1% |
| 2018 | 151,115 | 0.2% |
| 2017 | 150,783 | 0.6% |
| 2016 | 149,912 | 0.6% |
| 2015 | 149,079 | 1.0% |
| 2014 | 147,603 | 1.2% |
| 2013 | 145,859 | 1.1% |
| 2012 | 144,311 | 1.2% |
| 2011 | 142,573 | 1.1% |
| 2010 | 140,998 | - |
Race / Ethnicity in Escondido
See the full breakdown
Escondido is:
32.8% White with 49,059 White residents.
2.3% African American with 3,498 African American residents.
0.2% American Indian with 254 American Indian residents.
7.9% Asian with 11,840 Asian residents.
0.2% Hawaiian with 295 Hawaiian residents.
0.7% Other with 1,095 Other residents.
3.6% Two Or More with 5,335 Two Or More residents.
52.3% Hispanic with 78,292 Hispanic residents.
| Race | Escondido | CA | USA |
|---|---|---|---|
| White | 32.8% | 33.8% | 57.4% |
| African American | 2.3% | 5.2% | 11.9% |
| American Indian | 0.2% | 0.3% | 0.5% |
| Asian | 7.9% | 15.3% | 5.9% |
| Hawaiian | 0.2% | 0.3% | 0.2% |
| Other | 0.7% | 0.6% | 0.6% |
| Two Or More | 3.6% | 4.4% | 4.3% |
| Hispanic | 52.3% | 40.2% | 19.3% |
Gender in Escondido
See the full breakdown
Escondido is 49.9% female with 74,750 female residents.
Escondido is 50.1% male with 74,917 male residents.
| Gender | Escondido | CA | USA |
|---|---|---|---|
| Female | 49.9% | 50.1% | 50.5% |
| Male | 50.1% | 49.9% | 49.5% |
Highest level of educational attainment in Escondido for adults over 25
See the full breakdown
13.0% of adults in Escondido completed < 9th grade.
6.0% of adults in Escondido completed 9-12th grade.
23.0% of adults in Escondido completed high school / ged.
21.0% of adults in Escondido completed some college.
8.0% of adults in Escondido completed associate's degree.
19.0% of adults in Escondido completed bachelor's degree.
7.0% of adults in Escondido completed master's degree.
2.0% of adults in Escondido completed professional degree.
1.0% of adults in Escondido completed doctorate degree.
| Education | Escondido | CA | USA |
|---|---|---|---|
| < 9th Grade | 13.0% | 8.0% | 4.0% |
| 9-12th Grade | 6.0% | 7.0% | 6.0% |
| High School / GED | 23.0% | 20.0% | 26.0% |
| Some College | 21.0% | 19.0% | 19.0% |
| Associate's Degree | 8.0% | 8.0% | 9.0% |
| Bachelor's Degree | 19.0% | 23.0% | 22.0% |
| Master's Degree | 7.0% | 10.0% | 10.0% |
| Professional Degree | 2.0% | 3.0% | 2.0% |
| Doctorate Degree | 1.0% | 2.0% | 2.0% |
Household Income For Escondido, California
See the full breakdown
4.9% of households in Escondido earn Less than $10,000.
3.4% of households in Escondido earn $10,000 to $14,999.
6.3% of households in Escondido earn $15,000 to $24,999.
5.5% of households in Escondido earn $25,000 to $34,999.
7.9% of households in Escondido earn $35,000 to $49,999.
13.6% of households in Escondido earn $50,000 to $74,999.
12.0% of households in Escondido earn $75,000 to $99,999.
19.7% of households in Escondido earn $100,000 to $149,999.
10.9% of households in Escondido earn $150,000 to $199,999.
15.8% of households in Escondido earn $200,000 or more.
| Income | Escondido | CA | USA |
|---|---|---|---|
| Less than $10,000 | 4.9% | 4.5% | 5.0% |
| $10,000 to $14,999 | 3.4% | 2.9% | 3.4% |
| $15,000 to $24,999 | 6.3% | 5.0% | 6.3% |
| $25,000 to $34,999 | 5.5% | 5.3% | 6.6% |
| $35,000 to $49,999 | 7.9% | 8.1% | 10.1% |
| $50,000 to $74,999 | 13.6% | 13.0% | 15.5% |
| $75,000 to $99,999 | 12.0% | 11.6% | 12.6% |
| $100,000 to $149,999 | 19.7% | 17.8% | 17.5% |
| $150,000 to $199,999 | 10.9% | 11.3% | 9.6% |
| $200,000 or more | 15.8% | 20.5% | 13.4% |
Source: U.S. Census ACS 5-year estimates (2024)


