Santee, CA
Demographics And Statistics
Living In Santee, California Summary
Life in Santee research summary. HomeSnacks has been using Saturday Night Science to research the quality of life in Santee over the past nine years using Census, FBI, Zillow, and other primary data sources. Based on the most recently available data, we found the following about life in Santee:
The population in Santee is 59,485.
The median home value in Santee is $778,166.
The median income in Santee is $105,613.
The cost of living in Santee is 149 which is 1.5x higher than the national average.
The median rent in Santee is $2,197.
The unemployment rate in Santee is 5.1%.
The poverty rate in Santee is 8.5%.
The average high in Santee is 73.0° and the average low is 51.8°.
Santee SnackAbility
Overall SnackAbility
Santee, CA Crime Report
Crime in Santee summary. We use data from the FBI to determine the crime rates in Santee. Key points include:
There were 490 total crimes in Santee in the last reporting year.
The overall crime rate per 100,000 people in Santee is 825.6 / 100k people.
The violent crime rate per 100,000 people in Santee is 254.4 / 100k people.
The property crime rate per 100,000 people in Santee is 571.2 / 100k people.
Overall, crime in Santee is -61.04% below the national average.
Total Crimes
Below National Average
Crime In Santee Comparison Table
| Statistic | Count Raw |
Santee / 100k People |
California / 100k People |
National / 100k People |
|---|---|---|---|---|
| Total Crimes Per 100K | 490 | 825.6 | 2,564.5 | 2,119.2 |
| Violent Crime | 151 | 254.4 | 486.0 | 359.0 |
| Murder | 2 | 3.4 | 4.5 | 5.0 |
| Robbery | 25 | 42.1 | 119.1 | 61.0 |
| Aggravated Assault | 119 | 200.5 | 325.8 | 256.0 |
| Property Crime | 339 | 571.2 | 2,078.4 | 1,760.0 |
| Burglary | 45 | 75.8 | 305.8 | 229.0 |
| Larceny | 222 | 374.0 | 1,345.2 | 1,272.0 |
| Car Theft | 72 | 121.3 | 427.5 | 259.0 |
Santee, CA Cost Of Living
Cost of living in Santee summary. We use data on the cost of living to determine how expensive it is to live in Santee. Real estate prices drive most of the variance in cost of living around California. Key points include:
The cost of living in Santee is 149 with 100 being average.
The cost of living in Santee is 1.5x higher than the national average.
The median home value in Santee is $778,166.
The median income in Santee is $105,613.
Santee's Overall Cost Of Living
Higher Than The National Average
Cost Of Living In Santee Comparison Table
| Living Expense | Santee | California | National Average | |
|---|---|---|---|---|
| Overall | 149 | 141 | 100 | |
| Services | 115 | 110 | 100 | |
| Groceries | 114 | 112 | 100 | |
| Health | 104 | 110 | 100 | |
| Housing | 239 | 195 | 100 | |
| Transportation | 125 | 125 | 100 | |
| Utilities | 108 | 128 | 100 | |
Santee, CA Weather
The average high in Santee is 73.0° and the average low is 51.8°.
There are 24.3 days of precipitation each year.
Expect an average of 13.2 inches of precipitation each year with 1.2 inches of snow.
| Stat | Santee |
|---|---|
| Average Annual High | 73.0 |
| Average Annual Low | 51.8 |
| Annual Precipitation Days | 24.3 |
| Average Annual Precipitation | 13.2 |
| Average Annual Snowfall | 1.2 |
Average High
Days of Rain
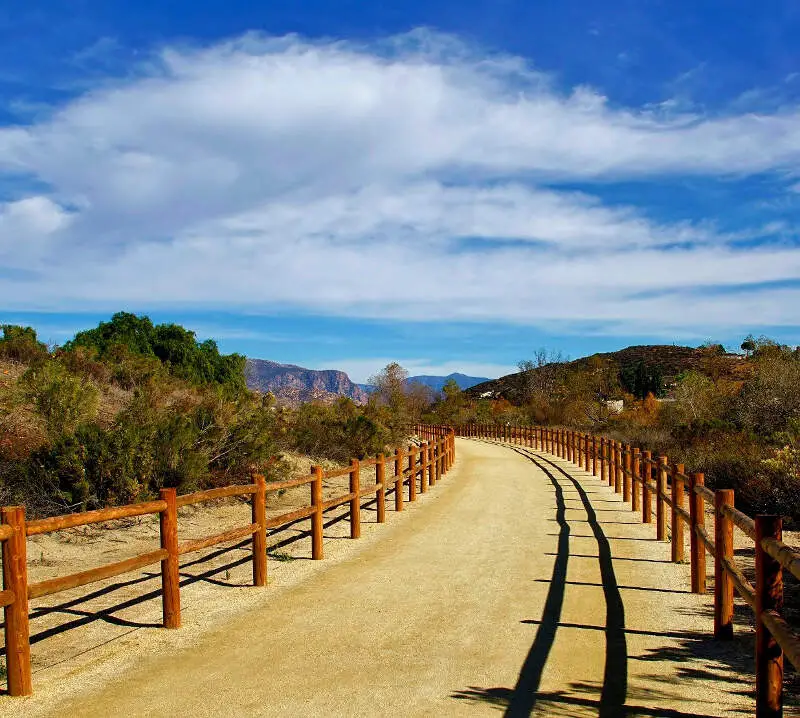
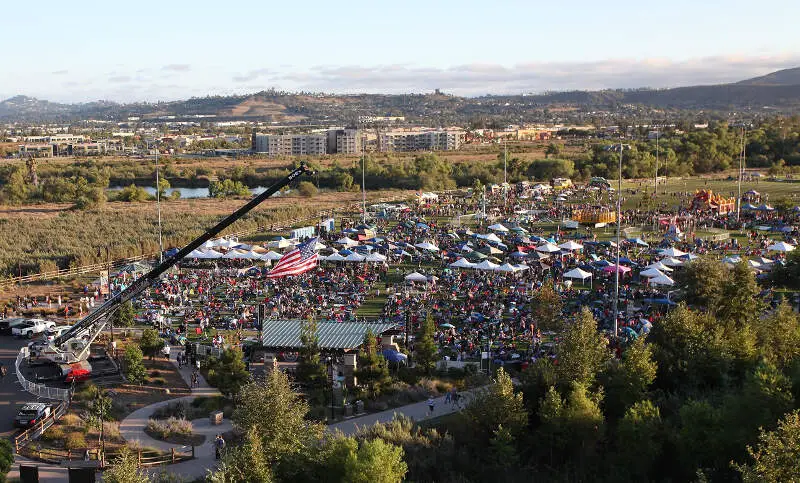
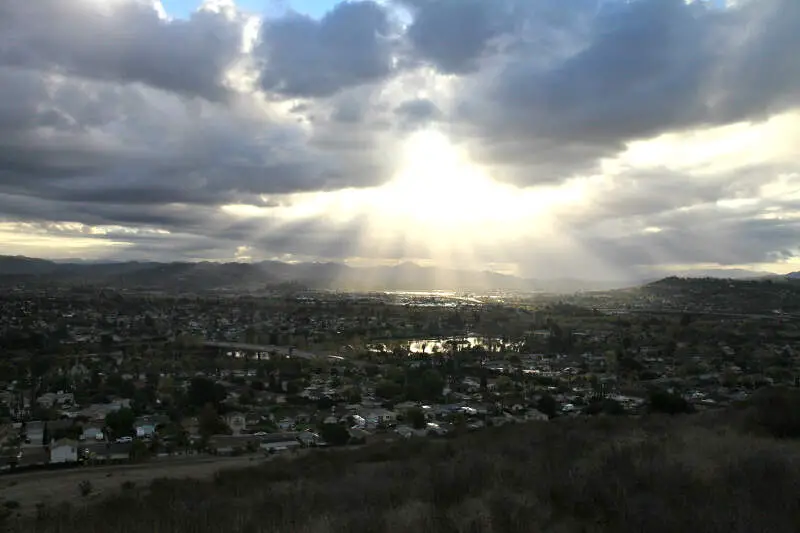
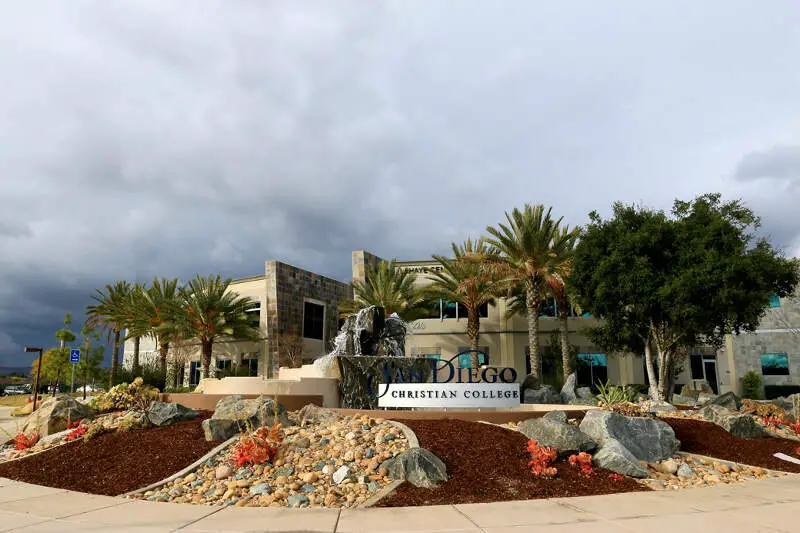
Santee, CA Photos

Rankings for Santee in California


Locations Around Santee
Map Of Santee, CA
Best Places Around Santee
Bonita, CA
Population 13,336
Poway, CA
Population 48,515
Rancho San Diego, CA
Population 22,264
Casa de Oro-Mount Helix, CA
Population 19,651
La Presa, CA
Population 36,669
Jamul, CA
Population 6,617
San Diego, CA
Population 1,385,061
Lemon Grove, CA
Population 27,489
Winter Gardens, CA
Population 22,003
Coronado, CA
Population 18,558
Santee Demographics And Statistics
Population over time in Santee
The current population in Santee is 59,485. The population has increased 12.3% from 2010.
| Year | Population | % Change |
|---|---|---|
| 2023 | 59,485 | -0.0% |
| 2022 | 59,497 | -0.3% |
| 2021 | 59,679 | 4.0% |
| 2020 | 57,407 | -0.7% |
| 2019 | 57,797 | 0.3% |
| 2018 | 57,615 | 0.4% |
| 2017 | 57,376 | 0.9% |
| 2016 | 56,839 | 1.0% |
| 2015 | 56,255 | 1.5% |
| 2014 | 55,435 | 1.6% |
| 2013 | 54,576 | 1.2% |
| 2012 | 53,926 | 1.2% |
| 2011 | 53,302 | 0.6% |
| 2010 | 52,966 | - |
Race / Ethnicity in Santee
Santee is:
63.5% White with 37,756 White residents.
1.9% African American with 1,143 African American residents.
0.2% American Indian with 128 American Indian residents.
5.4% Asian with 3,207 Asian residents.
0.2% Hawaiian with 98 Hawaiian residents.
0.2% Other with 147 Other residents.
6.7% Two Or More with 4,006 Two Or More residents.
21.9% Hispanic with 13,000 Hispanic residents.
| Race | Santee | CA | USA |
|---|---|---|---|
| White | 63.5% | 34.6% | 58.2% |
| African American | 1.9% | 5.3% | 12.0% |
| American Indian | 0.2% | 0.3% | 0.5% |
| Asian | 5.4% | 15.1% | 5.7% |
| Hawaiian | 0.2% | 0.3% | 0.2% |
| Other | 0.2% | 0.5% | 0.5% |
| Two Or More | 6.7% | 4.1% | 3.9% |
| Hispanic | 21.9% | 39.8% | 19.0% |
Gender in Santee
Santee is 50.4% female with 30,003 female residents.
Santee is 49.6% male with 29,482 male residents.
| Gender | Santee | CA | USA |
|---|---|---|---|
| Female | 50.4% | 50.0% | 50.5% |
| Male | 49.6% | 50.0% | 49.5% |
Highest level of educational attainment in Santee for adults over 25
1.0% of adults in Santee completed < 9th grade.
5.0% of adults in Santee completed 9-12th grade.
22.0% of adults in Santee completed high school / ged.
28.0% of adults in Santee completed some college.
10.0% of adults in Santee completed associate's degree.
23.0% of adults in Santee completed bachelor's degree.
8.0% of adults in Santee completed master's degree.
2.0% of adults in Santee completed professional degree.
1.0% of adults in Santee completed doctorate degree.
| Education | Santee | CA | USA |
|---|---|---|---|
| < 9th Grade | 1.0% | 8.0% | 5.0% |
| 9-12th Grade | 5.0% | 7.0% | 6.0% |
| High School / GED | 22.0% | 20.0% | 26.0% |
| Some College | 28.0% | 20.0% | 19.0% |
| Associate's Degree | 10.0% | 8.0% | 9.0% |
| Bachelor's Degree | 23.0% | 22.0% | 21.0% |
| Master's Degree | 8.0% | 10.0% | 10.0% |
| Professional Degree | 2.0% | 3.0% | 2.0% |
| Doctorate Degree | 1.0% | 2.0% | 2.0% |
Household Income For Santee, California
3.5% of households in Santee earn Less than $10,000.
2.9% of households in Santee earn $10,000 to $14,999.
4.7% of households in Santee earn $15,000 to $24,999.
4.4% of households in Santee earn $25,000 to $34,999.
7.4% of households in Santee earn $35,000 to $49,999.
12.7% of households in Santee earn $50,000 to $74,999.
11.6% of households in Santee earn $75,000 to $99,999.
21.5% of households in Santee earn $100,000 to $149,999.
14.5% of households in Santee earn $150,000 to $199,999.
16.9% of households in Santee earn $200,000 or more.
| Income | Santee | CA | USA |
|---|---|---|---|
| Less than $10,000 | 3.5% | 4.4% | 4.9% |
| $10,000 to $14,999 | 2.9% | 3.0% | 3.6% |
| $15,000 to $24,999 | 4.7% | 5.2% | 6.6% |
| $25,000 to $34,999 | 4.4% | 5.5% | 6.8% |
| $35,000 to $49,999 | 7.4% | 8.4% | 10.4% |
| $50,000 to $74,999 | 12.7% | 13.3% | 15.7% |
| $75,000 to $99,999 | 11.6% | 11.8% | 12.7% |
| $100,000 to $149,999 | 21.5% | 17.9% | 17.4% |
| $150,000 to $199,999 | 14.5% | 11.1% | 9.3% |
| $200,000 or more | 16.9% | 19.4% | 12.6% |


