Grass Valley, CA
Demographics And Statistics
Living In Grass Valley, California Summary
Life in Grass Valley research summary. HomeSnacks has been using Saturday Night Science to research the quality of life in Grass Valley over the past nine years using Census, FBI, Zillow, and other primary data sources. Based on the most recently available data, we found the following about life in Grass Valley:
The population in Grass Valley is 14,126.
The median home value in Grass Valley is $501,454.
The median income in Grass Valley is $48,850.
The cost of living in Grass Valley is 126 which is 1.3x higher than the national average.
The median rent in Grass Valley is $1,417.
The unemployment rate in Grass Valley is 4.0%.
The poverty rate in Grass Valley is 20.7%.
The average high in Grass Valley is 66.3° and the average low is 40.7°.
Grass Valley SnackAbility
Overall SnackAbility
Grass Valley, CA Crime Report
Crime in Grass Valley summary. We use data from the FBI to determine the crime rates in Grass Valley. Key points include:
There were 378 total crimes in Grass Valley in the last reporting year.
The overall crime rate per 100,000 people in Grass Valley is 2,686.6 / 100k people.
The violent crime rate per 100,000 people in Grass Valley is 540.2 / 100k people.
The property crime rate per 100,000 people in Grass Valley is 2,146.4 / 100k people.
Overall, crime in Grass Valley is 26.77% above the national average.
Total Crimes
Above National Average
Crime In Grass Valley Comparison Table
| Statistic | Count Raw |
Grass Valley / 100k People |
California / 100k People |
National / 100k People |
|---|---|---|---|---|
| Total Crimes Per 100K | 378 | 2,686.6 | 2,564.5 | 2,119.2 |
| Violent Crime | 76 | 540.2 | 486.0 | 359.0 |
| Murder | 0 | 0.0 | 4.5 | 5.0 |
| Robbery | 5 | 35.5 | 119.1 | 61.0 |
| Aggravated Assault | 58 | 412.2 | 325.8 | 256.0 |
| Property Crime | 302 | 2,146.4 | 2,078.4 | 1,760.0 |
| Burglary | 40 | 284.3 | 305.8 | 229.0 |
| Larceny | 201 | 1,428.6 | 1,345.2 | 1,272.0 |
| Car Theft | 61 | 433.5 | 427.5 | 259.0 |
Grass Valley, CA Cost Of Living
Cost of living in Grass Valley summary. We use data on the cost of living to determine how expensive it is to live in Grass Valley. Real estate prices drive most of the variance in cost of living around California. Key points include:
The cost of living in Grass Valley is 126 with 100 being average.
The cost of living in Grass Valley is 1.3x higher than the national average.
The median home value in Grass Valley is $501,454.
The median income in Grass Valley is $48,850.
Grass Valley's Overall Cost Of Living
Higher Than The National Average
Cost Of Living In Grass Valley Comparison Table
| Living Expense | Grass Valley | California | National Average | |
|---|---|---|---|---|
| Overall | 126 | 141 | 100 | |
| Services | 109 | 110 | 100 | |
| Groceries | 108 | 112 | 100 | |
| Health | 114 | 110 | 100 | |
| Housing | 164 | 195 | 100 | |
| Transportation | 121 | 125 | 100 | |
| Utilities | 115 | 128 | 100 | |
Grass Valley, CA Weather
The average high in Grass Valley is 66.3° and the average low is 40.7°.
There are 54.3 days of precipitation each year.
Expect an average of 47.5 inches of precipitation each year with 72.3 inches of snow.
| Stat | Grass Valley |
|---|---|
| Average Annual High | 66.3 |
| Average Annual Low | 40.7 |
| Annual Precipitation Days | 54.3 |
| Average Annual Precipitation | 47.5 |
| Average Annual Snowfall | 72.3 |
Average High
Days of Rain
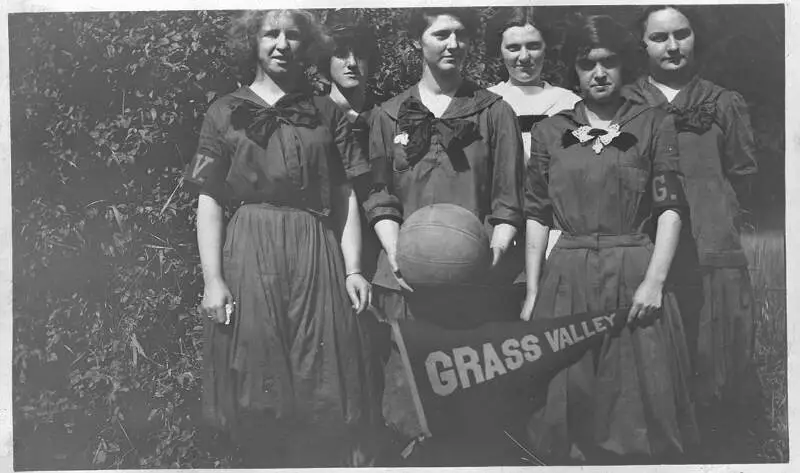
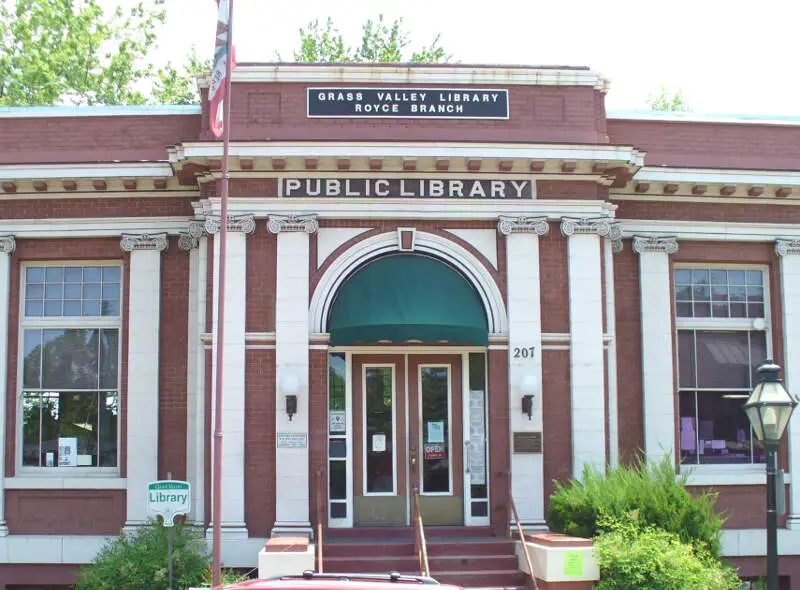
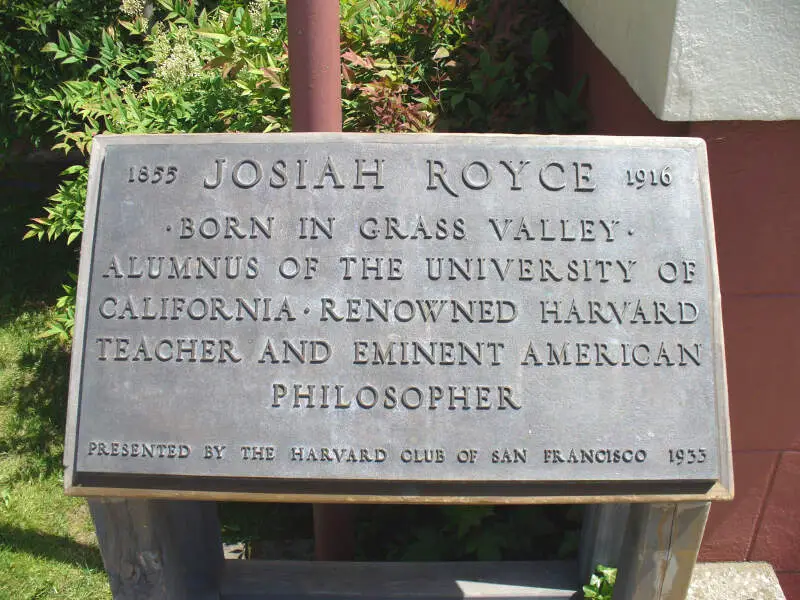
Grass Valley, CA Photos


Rankings for Grass Valley in California


Locations Around Grass Valley
Map Of Grass Valley, CA
Best Places Around Grass Valley
Gold River, CA
Population 7,661
Folsom, CA
Population 82,140
Rocklin, CA
Population 72,340
Orangevale, CA
Population 35,219
Granite Bay, CA
Population 21,378
El Dorado Hills, CA
Population 50,553
La Riviera, CA
Population 11,503
Fair Oaks, CA
Population 32,030
Antelope, CA
Population 49,080
Rosemont, CA
Population 23,448
Grass Valley Demographics And Statistics
Population over time in Grass Valley
The current population in Grass Valley is 14,126. The population has increased 10.7% from 2010.
| Year | Population | % Change |
|---|---|---|
| 2023 | 14,126 | 1.2% |
| 2022 | 13,964 | 3.1% |
| 2021 | 13,550 | 5.7% |
| 2020 | 12,817 | -0.6% |
| 2019 | 12,891 | -0.3% |
| 2018 | 12,932 | 0.3% |
| 2017 | 12,893 | 0.2% |
| 2016 | 12,861 | 0.0% |
| 2015 | 12,855 | -0.0% |
| 2014 | 12,861 | 0.1% |
| 2013 | 12,845 | 0.2% |
| 2012 | 12,818 | 0.2% |
| 2011 | 12,793 | 0.2% |
| 2010 | 12,765 | - |
Race / Ethnicity in Grass Valley
Grass Valley is:
79.5% White with 11,230 White residents.
0.4% African American with 56 African American residents.
0.2% American Indian with 25 American Indian residents.
1.7% Asian with 237 Asian residents.
0.0% Hawaiian with 0 Hawaiian residents.
1.1% Other with 161 Other residents.
8.4% Two Or More with 1,192 Two Or More residents.
8.7% Hispanic with 1,225 Hispanic residents.
| Race | Grass Valley | CA | USA |
|---|---|---|---|
| White | 79.5% | 34.6% | 58.2% |
| African American | 0.4% | 5.3% | 12.0% |
| American Indian | 0.2% | 0.3% | 0.5% |
| Asian | 1.7% | 15.1% | 5.7% |
| Hawaiian | 0.0% | 0.3% | 0.2% |
| Other | 1.1% | 0.5% | 0.5% |
| Two Or More | 8.4% | 4.1% | 3.9% |
| Hispanic | 8.7% | 39.8% | 19.0% |
Gender in Grass Valley
Grass Valley is 55.2% female with 7,797 female residents.
Grass Valley is 44.8% male with 6,329 male residents.
| Gender | Grass Valley | CA | USA |
|---|---|---|---|
| Female | 55.2% | 50.0% | 50.5% |
| Male | 44.8% | 50.0% | 49.5% |
Highest level of educational attainment in Grass Valley for adults over 25
0.0% of adults in Grass Valley completed < 9th grade.
7.0% of adults in Grass Valley completed 9-12th grade.
22.0% of adults in Grass Valley completed high school / ged.
30.0% of adults in Grass Valley completed some college.
8.0% of adults in Grass Valley completed associate's degree.
19.0% of adults in Grass Valley completed bachelor's degree.
10.0% of adults in Grass Valley completed master's degree.
2.0% of adults in Grass Valley completed professional degree.
2.0% of adults in Grass Valley completed doctorate degree.
| Education | Grass Valley | CA | USA |
|---|---|---|---|
| < 9th Grade | 0.0% | 8.0% | 5.0% |
| 9-12th Grade | 7.0% | 7.0% | 6.0% |
| High School / GED | 22.0% | 20.0% | 26.0% |
| Some College | 30.0% | 20.0% | 19.0% |
| Associate's Degree | 8.0% | 8.0% | 9.0% |
| Bachelor's Degree | 19.0% | 22.0% | 21.0% |
| Master's Degree | 10.0% | 10.0% | 10.0% |
| Professional Degree | 2.0% | 3.0% | 2.0% |
| Doctorate Degree | 2.0% | 2.0% | 2.0% |
Household Income For Grass Valley, California
8.1% of households in Grass Valley earn Less than $10,000.
6.1% of households in Grass Valley earn $10,000 to $14,999.
15.4% of households in Grass Valley earn $15,000 to $24,999.
9.2% of households in Grass Valley earn $25,000 to $34,999.
13.1% of households in Grass Valley earn $35,000 to $49,999.
18.3% of households in Grass Valley earn $50,000 to $74,999.
6.2% of households in Grass Valley earn $75,000 to $99,999.
14.0% of households in Grass Valley earn $100,000 to $149,999.
4.6% of households in Grass Valley earn $150,000 to $199,999.
5.0% of households in Grass Valley earn $200,000 or more.
| Income | Grass Valley | CA | USA |
|---|---|---|---|
| Less than $10,000 | 8.1% | 4.4% | 4.9% |
| $10,000 to $14,999 | 6.1% | 3.0% | 3.6% |
| $15,000 to $24,999 | 15.4% | 5.2% | 6.6% |
| $25,000 to $34,999 | 9.2% | 5.5% | 6.8% |
| $35,000 to $49,999 | 13.1% | 8.4% | 10.4% |
| $50,000 to $74,999 | 18.3% | 13.3% | 15.7% |
| $75,000 to $99,999 | 6.2% | 11.8% | 12.7% |
| $100,000 to $149,999 | 14.0% | 17.9% | 17.4% |
| $150,000 to $199,999 | 4.6% | 11.1% | 9.3% |
| $200,000 or more | 5.0% | 19.4% | 12.6% |


