Hayward SnackAbility
Overall SnackAbility
Crime in Hayward summary. We use data from the FBI to determine the crime rates in Hayward. Key points include:
There were 6,342 total crimes in Hayward in the last reporting year.
The overall crime rate per 100,000 people in Hayward is 4,133.8 / 100k people.
The violent crime rate per 100,000 people in Hayward is 477.1 / 100k people.
The property crime rate per 100,000 people in Hayward is 3,656.7 / 100k people.
Overall, crime in Hayward is 95.06% above the national average.
Total Crimes
Above National Average
Crime In Hayward Comparison Table
| Statistic | Count Raw |
Hayward / 100k People |
California / 100k People |
National / 100k People |
|---|---|---|---|---|
| Total Crimes Per 100K | 6,342 | 4,133.8 | 2,564.5 | 2,119.2 |
| Violent Crime | 732 | 477.1 | 486.0 | 359.0 |
| Murder | 12 | 7.8 | 4.5 | 5.0 |
| Robbery | 267 | 174.0 | 119.1 | 61.0 |
| Aggravated Assault | 381 | 248.3 | 325.8 | 256.0 |
| Property Crime | 5,610 | 3,656.7 | 2,078.4 | 1,760.0 |
| Burglary | 559 | 364.4 | 305.8 | 229.0 |
| Larceny | 2,939 | 1,915.7 | 1,345.2 | 1,272.0 |
| Car Theft | 2,112 | 1,376.6 | 427.5 | 259.0 |
Source: FBI Uniform Crime Reporting (2024)
Cost of living in Hayward summary. We use data on the cost of living to determine how expensive it is to live in Hayward. Real estate prices drive most of the variance in cost of living around California. Key points include:
The cost of living in Hayward is 174 with 100 being average.
The cost of living in Hayward is 1.7x higher than the national average.
The median home value in Hayward is $848,427.
The median income in Hayward is $113,318.
Hayward's Overall Cost Of Living
Higher Than The National Average
Cost Of Living In Hayward Comparison Table
| Living Expense | Hayward | California | National Average |
|---|---|---|---|
| Overall | 174 | 142 | 100 |
| Services | 118 | 110 | 100 |
| Groceries | 119 | 118 | 100 |
| Health | 293 | 197 | 100 |
| Housing | 127 | 120 | 100 |
| Transportation | 121 | 121 | 100 |
| Utilities | 124 | 121 | 100 |
Source: Cost of living index, normalized to US average = 100
Hayward, CA Weather
The average high in Hayward is 67.8° and the average low is 49.9°.
There are 42.8 days of precipitation each year.
Expect an average of 21.8 inches of precipitation each year with 0.0 inches of snow.
| Stat | Hayward |
|---|---|
| Average Annual High | 67.8 |
| Average Annual Low | 49.9 |
| Annual Precipitation Days | 42.8 |
| Average Annual Precipitation | 21.8 |
| Average Annual Snowfall | 0.0 |
Average High
Days of Rain
Source: NOAA climate normals (30-year)
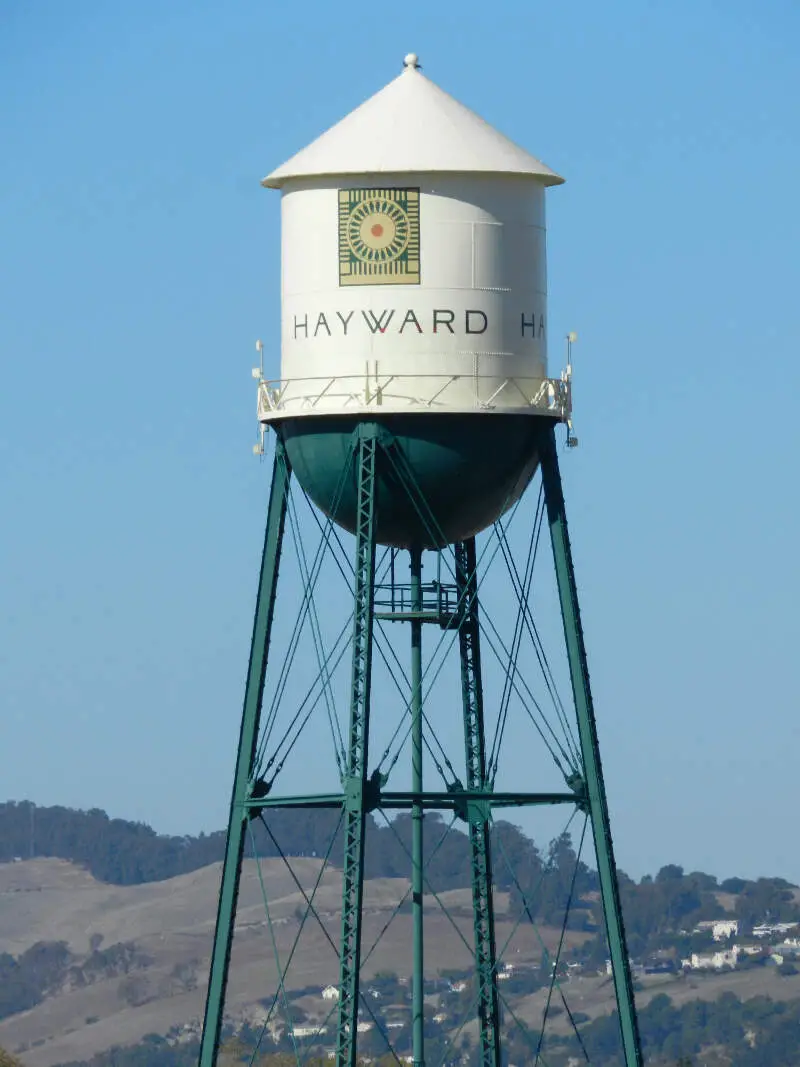
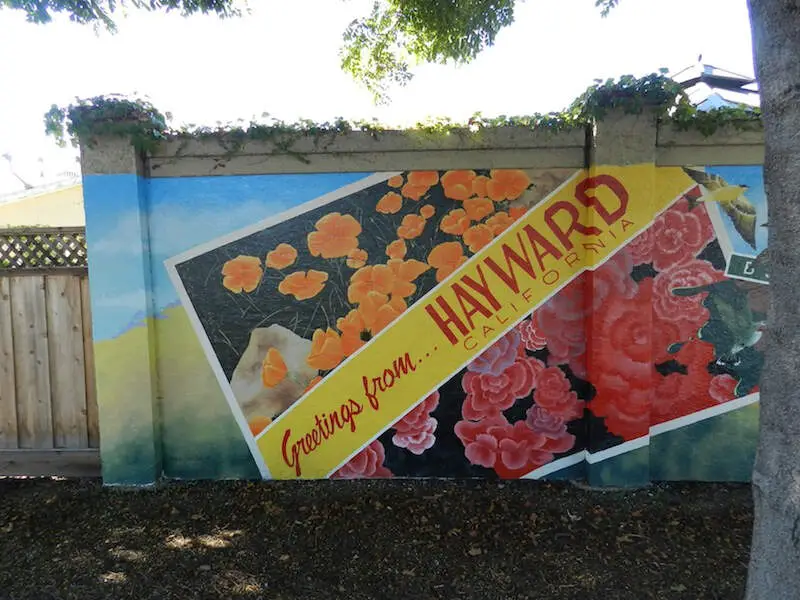
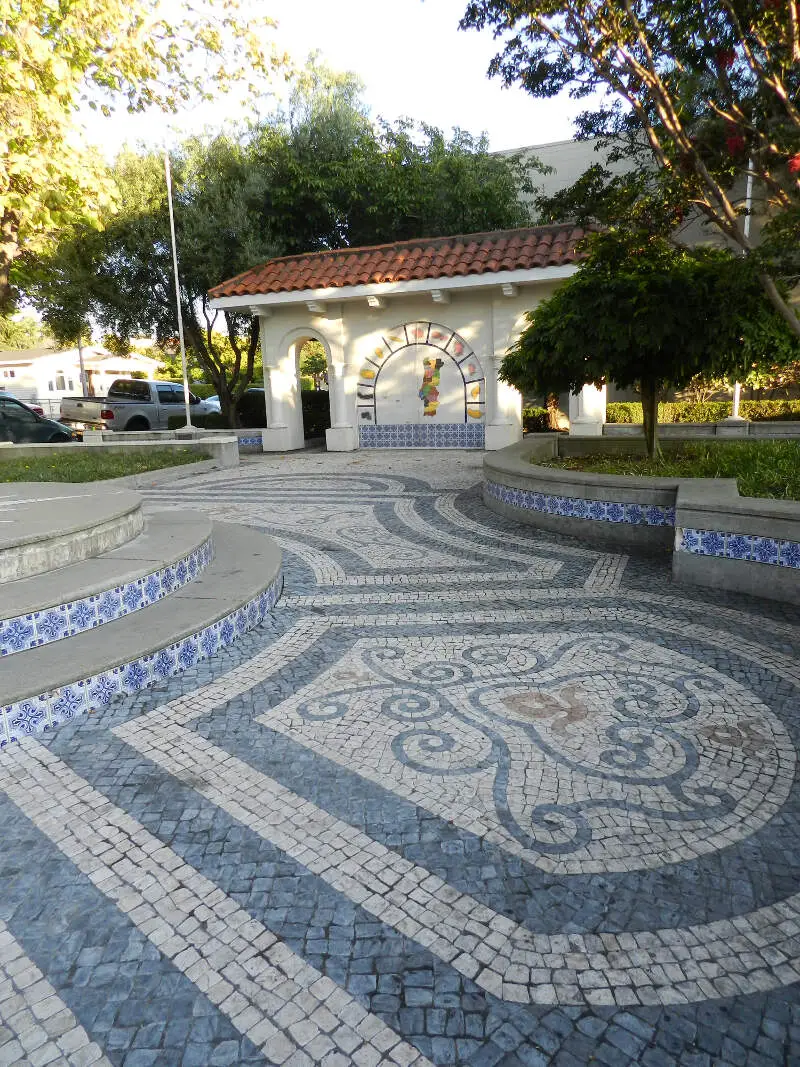
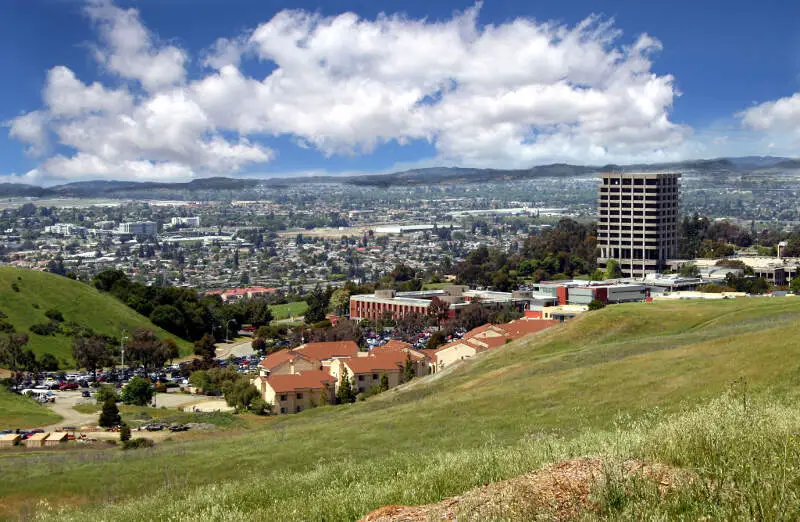
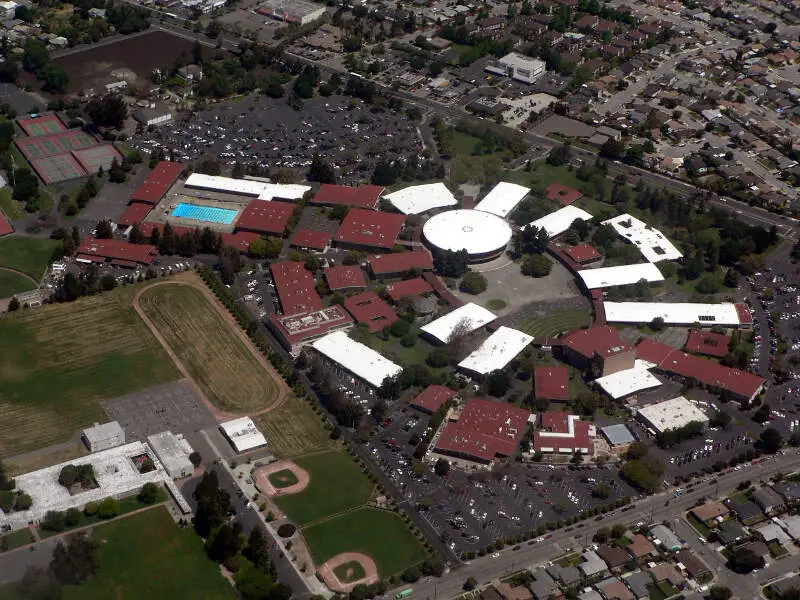
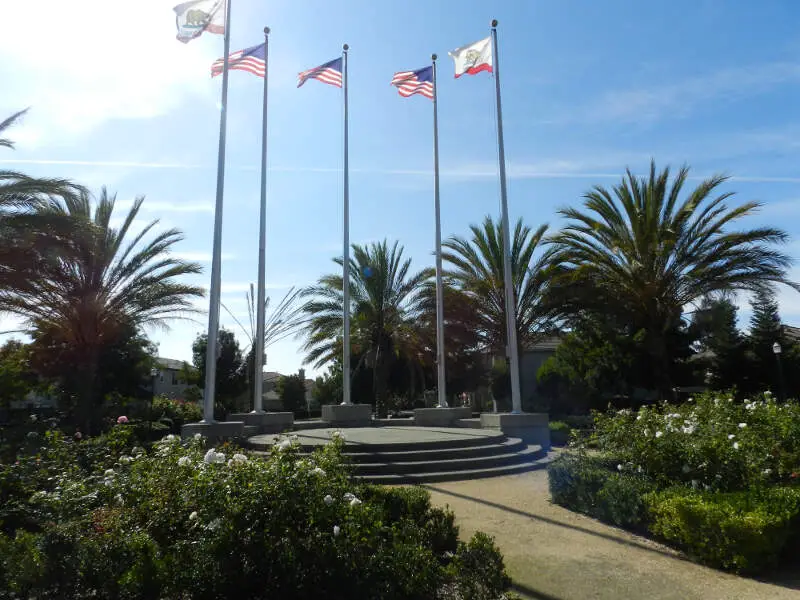
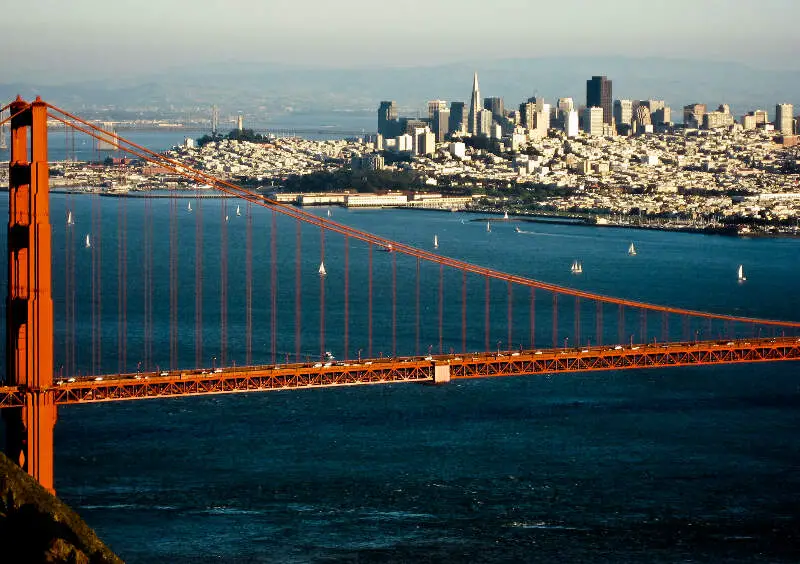
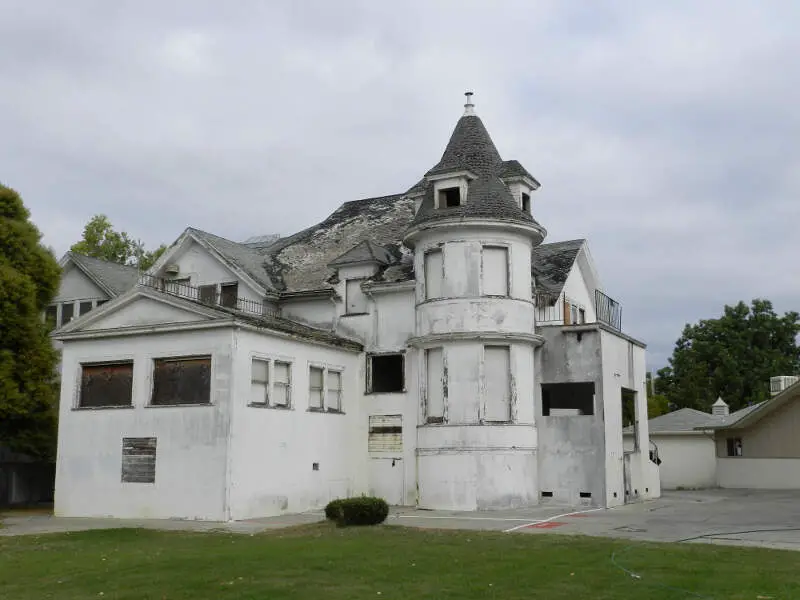
Hayward, CA Photos

1 Reviews & Comments About Hayward

The crime was low. The community college offer good classes for residents of California at affordable rates. The area is quiet and peaceful.
Favorite place was to go to the Mall nearby the place I lived.
Rankings & Articles For Hayward


Locations Around Hayward
Map Of Hayward, CA
Best Places Around Hayward
San Carlos, CA
Population 29,614
Piedmont, CA
Population 10,945
San Lorenzo, CA
Population 29,171
Los Altos, CA
Population 30,698
San Mateo, CA
Population 103,105
San Bruno, CA
Population 42,307
Belmont, CA
Population 27,337
San Ramon, CA
Population 85,993
Sunnyvale, CA
Population 154,236
Pleasanton, CA
Population 76,960
Hayward Demographics And Statistics
Population over time in Hayward
The current population in Hayward is 158,801. The population has increased 12.2% from 2010.
| Year | Population | % Change |
|---|---|---|
| 2024 | 158,801 | -0.3% |
| 2023 | 159,201 | -0.9% |
| 2022 | 160,602 | -1.0% |
| 2021 | 162,254 | 2.2% |
| 2020 | 158,817 | -0.3% |
| 2019 | 159,293 | 0.7% |
| 2018 | 158,241 | 0.8% |
| 2017 | 156,917 | 1.6% |
| 2016 | 154,507 | 1.4% |
| 2015 | 152,401 | 1.9% |
| 2014 | 149,596 | 1.7% |
| 2013 | 147,163 | 1.4% |
| 2012 | 145,165 | 1.6% |
| 2011 | 142,936 | 1.0% |
| 2010 | 141,498 | - |
Race / Ethnicity in Hayward
See the full breakdown
Hayward is:
12.7% White with 20,181 White residents.
7.6% African American with 12,032 African American residents.
0.2% American Indian with 332 American Indian residents.
30.0% Asian with 47,633 Asian residents.
2.8% Hawaiian with 4,409 Hawaiian residents.
0.5% Other with 851 Other residents.
4.9% Two Or More with 7,837 Two Or More residents.
41.3% Hispanic with 65,526 Hispanic residents.
| Race | Hayward | CA | USA |
|---|---|---|---|
| White | 12.7% | 33.8% | 57.4% |
| African American | 7.6% | 5.2% | 11.9% |
| American Indian | 0.2% | 0.3% | 0.5% |
| Asian | 30.0% | 15.3% | 5.9% |
| Hawaiian | 2.8% | 0.3% | 0.2% |
| Other | 0.5% | 0.6% | 0.6% |
| Two Or More | 4.9% | 4.4% | 4.3% |
| Hispanic | 41.3% | 40.2% | 19.3% |
Gender in Hayward
See the full breakdown
Hayward is 49.9% female with 79,261 female residents.
Hayward is 50.1% male with 79,540 male residents.
| Gender | Hayward | CA | USA |
|---|---|---|---|
| Female | 49.9% | 50.1% | 50.5% |
| Male | 50.1% | 49.9% | 49.5% |
Highest level of educational attainment in Hayward for adults over 25
See the full breakdown
12.0% of adults in Hayward completed < 9th grade.
7.0% of adults in Hayward completed 9-12th grade.
24.0% of adults in Hayward completed high school / ged.
17.0% of adults in Hayward completed some college.
7.0% of adults in Hayward completed associate's degree.
24.0% of adults in Hayward completed bachelor's degree.
7.0% of adults in Hayward completed master's degree.
1.0% of adults in Hayward completed professional degree.
1.0% of adults in Hayward completed doctorate degree.
| Education | Hayward | CA | USA |
|---|---|---|---|
| < 9th Grade | 12.0% | 8.0% | 4.0% |
| 9-12th Grade | 7.0% | 7.0% | 6.0% |
| High School / GED | 24.0% | 20.0% | 26.0% |
| Some College | 17.0% | 19.0% | 19.0% |
| Associate's Degree | 7.0% | 8.0% | 9.0% |
| Bachelor's Degree | 24.0% | 23.0% | 22.0% |
| Master's Degree | 7.0% | 10.0% | 10.0% |
| Professional Degree | 1.0% | 3.0% | 2.0% |
| Doctorate Degree | 1.0% | 2.0% | 2.0% |
Household Income For Hayward, California
See the full breakdown
3.7% of households in Hayward earn Less than $10,000.
1.9% of households in Hayward earn $10,000 to $14,999.
3.6% of households in Hayward earn $15,000 to $24,999.
4.4% of households in Hayward earn $25,000 to $34,999.
7.5% of households in Hayward earn $35,000 to $49,999.
10.1% of households in Hayward earn $50,000 to $74,999.
12.8% of households in Hayward earn $75,000 to $99,999.
19.0% of households in Hayward earn $100,000 to $149,999.
14.0% of households in Hayward earn $150,000 to $199,999.
22.9% of households in Hayward earn $200,000 or more.
| Income | Hayward | CA | USA |
|---|---|---|---|
| Less than $10,000 | 3.7% | 4.5% | 5.0% |
| $10,000 to $14,999 | 1.9% | 2.9% | 3.4% |
| $15,000 to $24,999 | 3.6% | 5.0% | 6.3% |
| $25,000 to $34,999 | 4.4% | 5.3% | 6.6% |
| $35,000 to $49,999 | 7.5% | 8.1% | 10.1% |
| $50,000 to $74,999 | 10.1% | 13.0% | 15.5% |
| $75,000 to $99,999 | 12.8% | 11.6% | 12.6% |
| $100,000 to $149,999 | 19.0% | 17.8% | 17.5% |
| $150,000 to $199,999 | 14.0% | 11.3% | 9.6% |
| $200,000 or more | 22.9% | 20.5% | 13.4% |
Source: U.S. Census ACS 5-year estimates (2024)


