Compare Lancaster to…
Lancaster SnackAbility
Overall SnackAbility
Crime in Lancaster summary. We use data from the FBI to determine the crime rates in Lancaster. Key points include:
There were 4,519 total crimes in Lancaster in the last reporting year.
The overall crime rate per 100,000 people in Lancaster is 2,755.3 / 100k people.
The violent crime rate per 100,000 people in Lancaster is 834.7 / 100k people.
The property crime rate per 100,000 people in Lancaster is 1,920.6 / 100k people.
Overall, crime in Lancaster is 30.01% above the national average.
Total Crimes
Above National Average
Crime In Lancaster Comparison Table
| Statistic | Count Raw |
Lancaster / 100k People |
California / 100k People |
National / 100k People |
|---|---|---|---|---|
| Total Crimes Per 100K | 4,519 | 2,755.3 | 2,564.5 | 2,119.2 |
| Violent Crime | 1,369 | 834.7 | 486.0 | 359.0 |
| Murder | 29 | 17.7 | 4.5 | 5.0 |
| Robbery | 282 | 171.9 | 119.1 | 61.0 |
| Aggravated Assault | 981 | 598.1 | 325.8 | 256.0 |
| Property Crime | 3,150 | 1,920.6 | 2,078.4 | 1,760.0 |
| Burglary | 631 | 384.7 | 305.8 | 229.0 |
| Larceny | 1,121 | 683.5 | 1,345.2 | 1,272.0 |
| Car Theft | 1,398 | 852.4 | 427.5 | 259.0 |
Source: FBI Uniform Crime Reporting (2024)
Cost of living in Lancaster summary. We use data on the cost of living to determine how expensive it is to live in Lancaster. Real estate prices drive most of the variance in cost of living around California. Key points include:
The cost of living in Lancaster is 127 with 100 being average.
The cost of living in Lancaster is 1.3x higher than the national average.
The median home value in Lancaster is $465,846.
The median income in Lancaster is $81,511.
Lancaster's Overall Cost Of Living
Higher Than The National Average
Cost Of Living In Lancaster Comparison Table
| Living Expense | Lancaster | California | National Average |
|---|---|---|---|
| Overall | 127 | 142 | 100 |
| Services | 108 | 110 | 100 |
| Groceries | 118 | 118 | 100 |
| Health | 147 | 197 | 100 |
| Housing | 118 | 120 | 100 |
| Transportation | 118 | 121 | 100 |
| Utilities | 122 | 121 | 100 |
Source: Cost of living index, normalized to US average = 100
Lancaster, CA Weather
The average high in Lancaster is 75.3° and the average low is 54.1°.
There are 22.7 days of precipitation each year.
Expect an average of 16.2 inches of precipitation each year with 0.2 inches of snow.
| Stat | Lancaster |
|---|---|
| Average Annual High | 75.3 |
| Average Annual Low | 54.1 |
| Annual Precipitation Days | 22.7 |
| Average Annual Precipitation | 16.2 |
| Average Annual Snowfall | 0.2 |
Average High
Days of Rain
Source: NOAA climate normals (30-year)
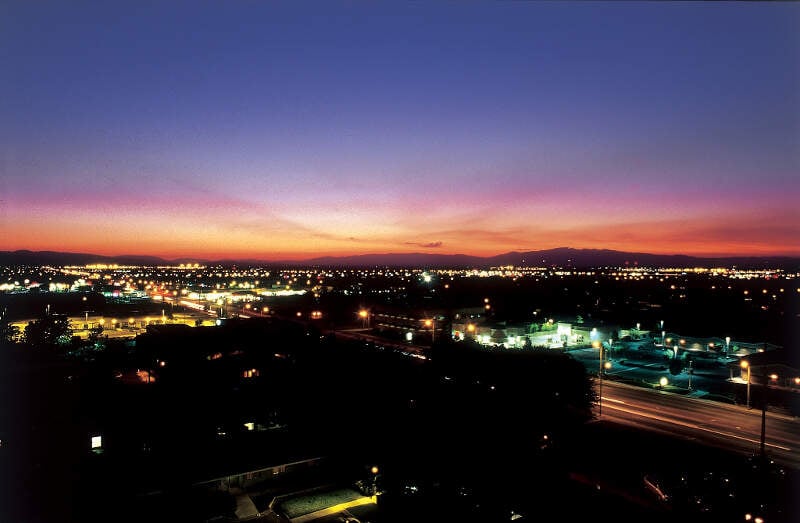
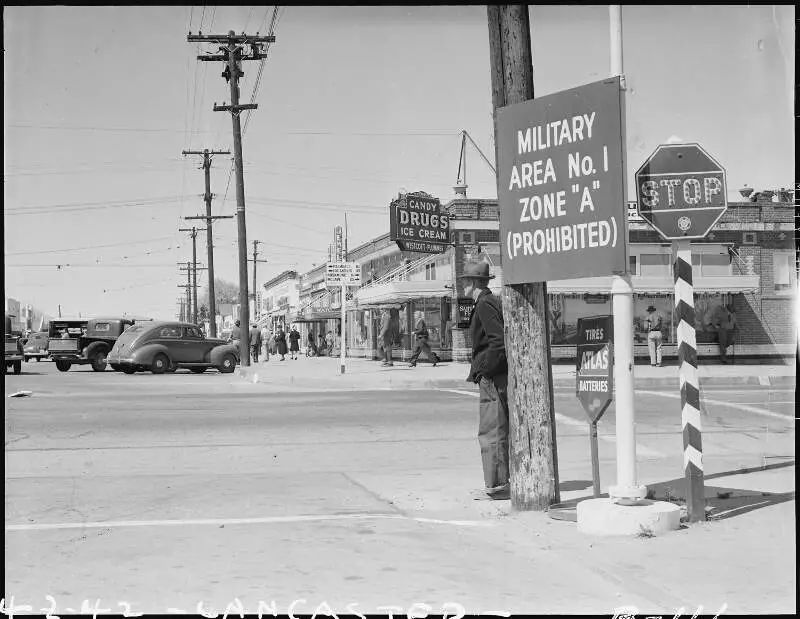
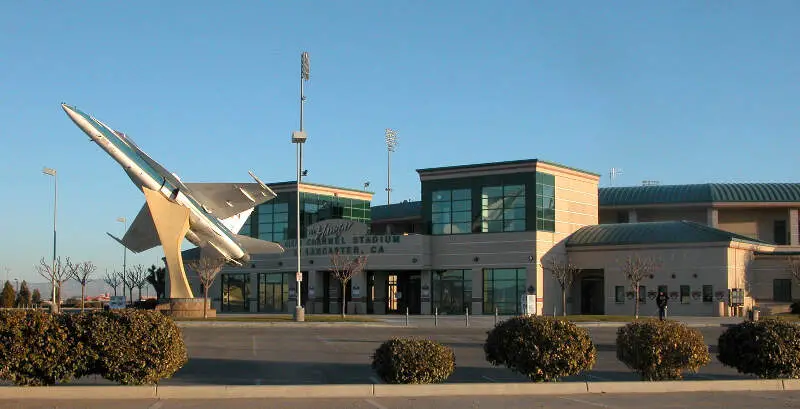
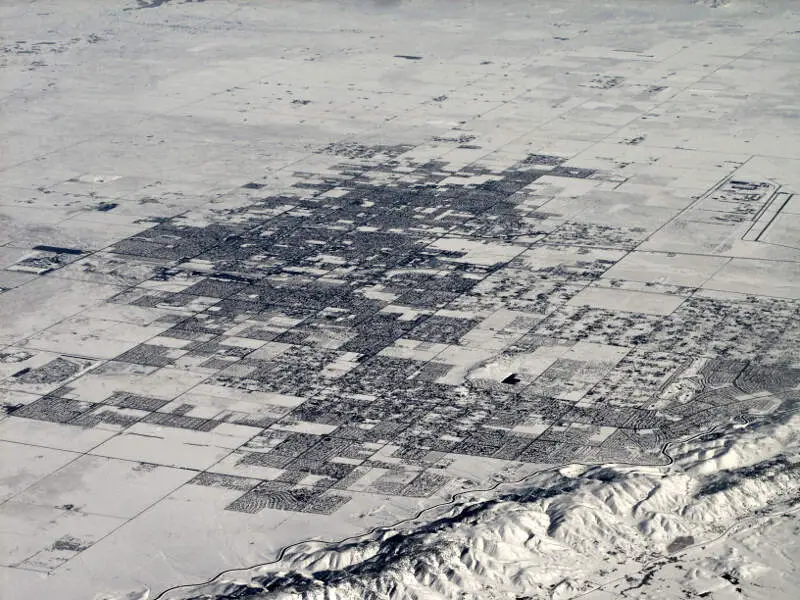
Lancaster, CA Photos
Rankings & Articles For Lancaster


Locations Around Lancaster
Map Of Lancaster, CA
Best Places Around Lancaster
Vincent, CA
Population 15,340
West Puente Valley, CA
Population 22,495
Citrus, CA
Population 10,904
South Monrovia Island, CA
Population 6,830
La Verne, CA
Population 30,600
Moorpark, CA
Population 35,854
Walnut, CA
Population 27,611
Avocado Heights, CA
Population 12,593
Oak Park, CA
Population 13,757
Valinda, CA
Population 20,962
Lancaster Demographics And Statistics
Population over time in Lancaster
The current population in Lancaster is 169,169. The population has increased 13.0% from 2010.
| Year | Population | % Change |
|---|---|---|
| 2024 | 169,169 | -0.5% |
| 2023 | 170,013 | -0.8% |
| 2022 | 171,465 | -0.2% |
| 2021 | 171,820 | 9.0% |
| 2020 | 157,697 | -0.8% |
| 2019 | 159,028 | -0.4% |
| 2018 | 159,662 | -0.3% |
| 2017 | 160,113 | 0.3% |
| 2016 | 159,651 | -0.1% |
| 2015 | 159,774 | 0.4% |
| 2014 | 159,092 | 1.1% |
| 2013 | 157,368 | 1.2% |
| 2012 | 155,496 | 1.8% |
| 2011 | 152,678 | 2.0% |
| 2010 | 149,709 | - |
Race / Ethnicity in Lancaster
See the full breakdown
Lancaster is:
23.5% White with 39,734 White residents.
19.1% African American with 32,313 African American residents.
0.2% American Indian with 273 American Indian residents.
4.1% Asian with 6,967 Asian residents.
0.2% Hawaiian with 301 Hawaiian residents.
0.6% Other with 1,098 Other residents.
4.1% Two Or More with 6,971 Two Or More residents.
48.2% Hispanic with 81,512 Hispanic residents.
| Race | Lancaster | CA | USA |
|---|---|---|---|
| White | 23.5% | 33.8% | 57.4% |
| African American | 19.1% | 5.2% | 11.9% |
| American Indian | 0.2% | 0.3% | 0.5% |
| Asian | 4.1% | 15.3% | 5.9% |
| Hawaiian | 0.2% | 0.3% | 0.2% |
| Other | 0.6% | 0.6% | 0.6% |
| Two Or More | 4.1% | 4.4% | 4.3% |
| Hispanic | 48.2% | 40.2% | 19.3% |
Gender in Lancaster
See the full breakdown
Lancaster is 50.0% female with 84,620 female residents.
Lancaster is 50.0% male with 84,548 male residents.
| Gender | Lancaster | CA | USA |
|---|---|---|---|
| Female | 50.0% | 50.1% | 50.5% |
| Male | 50.0% | 49.9% | 49.5% |
Highest level of educational attainment in Lancaster for adults over 25
See the full breakdown
7.0% of adults in Lancaster completed < 9th grade.
10.0% of adults in Lancaster completed 9-12th grade.
29.0% of adults in Lancaster completed high school / ged.
24.0% of adults in Lancaster completed some college.
9.0% of adults in Lancaster completed associate's degree.
12.0% of adults in Lancaster completed bachelor's degree.
7.0% of adults in Lancaster completed master's degree.
1.0% of adults in Lancaster completed professional degree.
1.0% of adults in Lancaster completed doctorate degree.
| Education | Lancaster | CA | USA |
|---|---|---|---|
| < 9th Grade | 7.0% | 8.0% | 4.0% |
| 9-12th Grade | 10.0% | 7.0% | 6.0% |
| High School / GED | 29.0% | 20.0% | 26.0% |
| Some College | 24.0% | 19.0% | 19.0% |
| Associate's Degree | 9.0% | 8.0% | 9.0% |
| Bachelor's Degree | 12.0% | 23.0% | 22.0% |
| Master's Degree | 7.0% | 10.0% | 10.0% |
| Professional Degree | 1.0% | 3.0% | 2.0% |
| Doctorate Degree | 1.0% | 2.0% | 2.0% |
Household Income For Lancaster, California
See the full breakdown
5.5% of households in Lancaster earn Less than $10,000.
4.5% of households in Lancaster earn $10,000 to $14,999.
6.1% of households in Lancaster earn $15,000 to $24,999.
5.9% of households in Lancaster earn $25,000 to $34,999.
10.5% of households in Lancaster earn $35,000 to $49,999.
13.7% of households in Lancaster earn $50,000 to $74,999.
15.0% of households in Lancaster earn $75,000 to $99,999.
19.5% of households in Lancaster earn $100,000 to $149,999.
11.0% of households in Lancaster earn $150,000 to $199,999.
8.4% of households in Lancaster earn $200,000 or more.
| Income | Lancaster | CA | USA |
|---|---|---|---|
| Less than $10,000 | 5.5% | 4.5% | 5.0% |
| $10,000 to $14,999 | 4.5% | 2.9% | 3.4% |
| $15,000 to $24,999 | 6.1% | 5.0% | 6.3% |
| $25,000 to $34,999 | 5.9% | 5.3% | 6.6% |
| $35,000 to $49,999 | 10.5% | 8.1% | 10.1% |
| $50,000 to $74,999 | 13.7% | 13.0% | 15.5% |
| $75,000 to $99,999 | 15.0% | 11.6% | 12.6% |
| $100,000 to $149,999 | 19.5% | 17.8% | 17.5% |
| $150,000 to $199,999 | 11.0% | 11.3% | 9.6% |
| $200,000 or more | 8.4% | 20.5% | 13.4% |
Source: U.S. Census ACS 5-year estimates (2024)


