Milpitas, CA
Demographics And Statistics
Living In Milpitas, California Summary
Life in Milpitas research summary. HomeSnacks has been using Saturday Night Science to research the quality of life in Milpitas over the past nine years using Census, FBI, Zillow, and other primary data sources. Based on the most recently available data, we found the following about life in Milpitas:
The population in Milpitas is 78,216.
The median home value in Milpitas is $1,431,087.
The median income in Milpitas is $176,822.
The cost of living in Milpitas is 213 which is 2.1x higher than the national average.
The median rent in Milpitas is $3,112.
The unemployment rate in Milpitas is 4.1%.
The poverty rate in Milpitas is 5.4%.
The average high in Milpitas is 71.1° and the average low is 48.8°.
Milpitas SnackAbility
Overall SnackAbility
Milpitas, CA Crime Report
Crime in Milpitas summary. We use data from the FBI to determine the crime rates in Milpitas. Key points include:
There were 2,676 total crimes in Milpitas in the last reporting year.
The overall crime rate per 100,000 people in Milpitas is 3,497.0 / 100k people.
The violent crime rate per 100,000 people in Milpitas is 313.6 / 100k people.
The property crime rate per 100,000 people in Milpitas is 3,183.4 / 100k people.
Overall, crime in Milpitas is 65.01% above the national average.
Total Crimes
Above National Average
Crime In Milpitas Comparison Table
| Statistic | Count Raw |
Milpitas / 100k People |
California / 100k People |
National / 100k People |
|---|---|---|---|---|
| Total Crimes Per 100K | 2,676 | 3,497.0 | 2,564.5 | 2,119.2 |
| Violent Crime | 240 | 313.6 | 486.0 | 359.0 |
| Murder | 3 | 3.9 | 4.5 | 5.0 |
| Robbery | 64 | 83.6 | 119.1 | 61.0 |
| Aggravated Assault | 140 | 183.0 | 325.8 | 256.0 |
| Property Crime | 2,436 | 3,183.4 | 2,078.4 | 1,760.0 |
| Burglary | 189 | 247.0 | 305.8 | 229.0 |
| Larceny | 1,943 | 2,539.1 | 1,345.2 | 1,272.0 |
| Car Theft | 304 | 397.3 | 427.5 | 259.0 |
Milpitas, CA Cost Of Living
Cost of living in Milpitas summary. We use data on the cost of living to determine how expensive it is to live in Milpitas. Real estate prices drive most of the variance in cost of living around California. Key points include:
The cost of living in Milpitas is 213 with 100 being average.
The cost of living in Milpitas is 2.1x higher than the national average.
The median home value in Milpitas is $1,431,087.
The median income in Milpitas is $176,822.
Milpitas's Overall Cost Of Living
Higher Than The National Average
Cost Of Living In Milpitas Comparison Table
| Living Expense | Milpitas | California | National Average | |
|---|---|---|---|---|
| Overall | 213 | 141 | 100 | |
| Services | 108 | 110 | 100 | |
| Groceries | 114 | 112 | 100 | |
| Health | 124 | 110 | 100 | |
| Housing | 436 | 195 | 100 | |
| Transportation | 130 | 125 | 100 | |
| Utilities | 133 | 128 | 100 | |
Milpitas, CA Weather
The average high in Milpitas is 71.1° and the average low is 48.8°.
There are 37.9 days of precipitation each year.
Expect an average of 17.4 inches of precipitation each year with 1.6 inches of snow.
| Stat | Milpitas |
|---|---|
| Average Annual High | 71.1 |
| Average Annual Low | 48.8 |
| Annual Precipitation Days | 37.9 |
| Average Annual Precipitation | 17.4 |
| Average Annual Snowfall | 1.6 |
Average High
Days of Rain
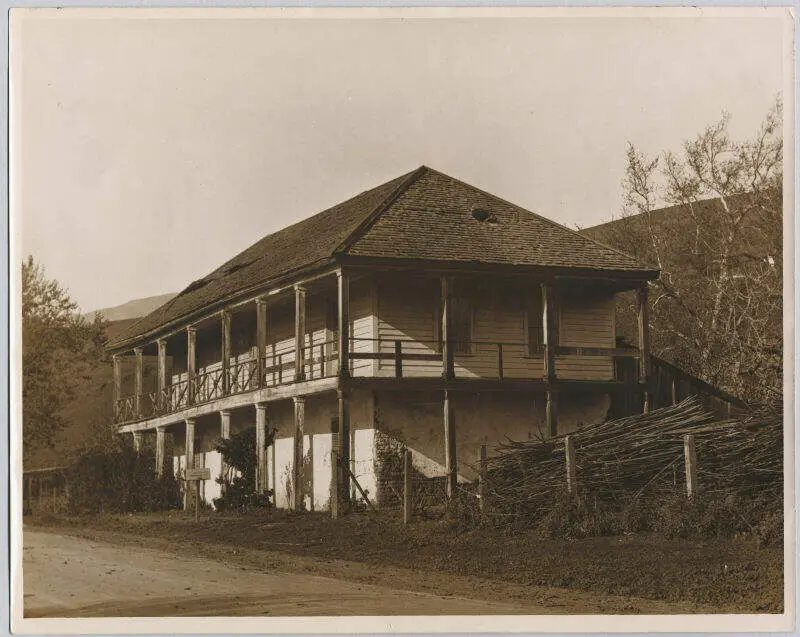
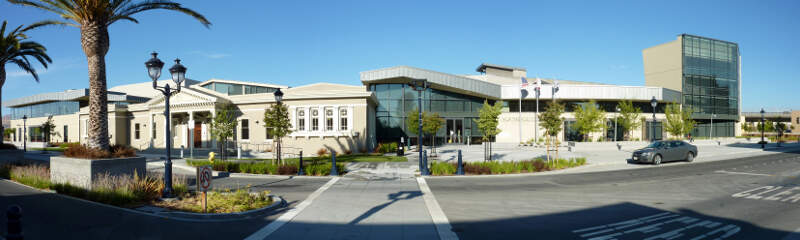
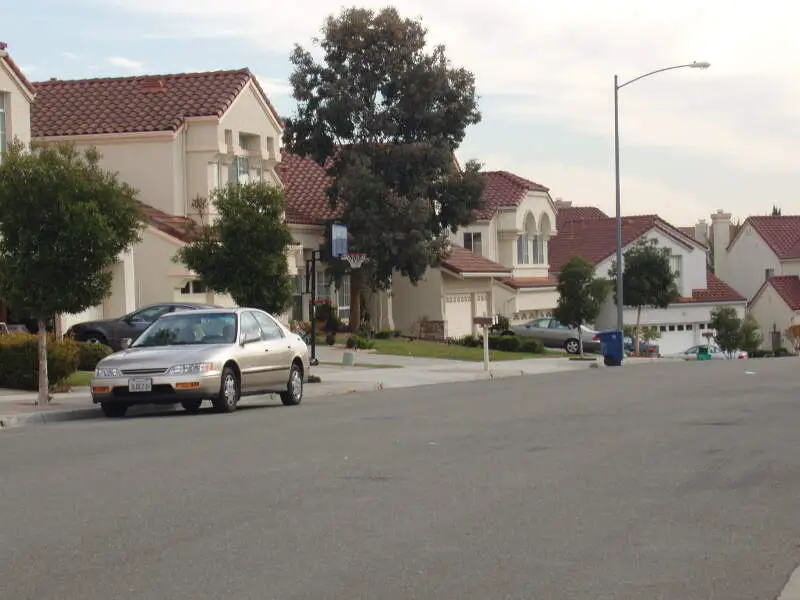
Milpitas, CA Photos


Rankings for Milpitas in California


Locations Around Milpitas
Map Of Milpitas, CA
Best Places Around Milpitas
East Foothills, CA
Population 8,630
Cupertino, CA
Population 58,886
Los Altos, CA
Population 30,736
Sunnyvale, CA
Population 153,455
Pleasanton, CA
Population 77,500
North Fair Oaks, CA
Population 13,327
Menlo Park, CA
Population 32,775
Fairview, CA
Population 10,033
Santa Clara, CA
Population 129,239
Dublin, CA
Population 70,542
Milpitas Demographics And Statistics
Population over time in Milpitas
The current population in Milpitas is 78,216. The population has increased 20.1% from 2010.
| Year | Population | % Change |
|---|---|---|
| 2023 | 78,216 | -1.1% |
| 2022 | 79,092 | -0.6% |
| 2021 | 79,593 | 5.9% |
| 2020 | 75,182 | -5.5% |
| 2019 | 79,517 | 2.7% |
| 2018 | 77,457 | 2.6% |
| 2017 | 75,498 | 2.8% |
| 2016 | 73,447 | 2.7% |
| 2015 | 71,533 | 3.2% |
| 2014 | 69,346 | 2.4% |
| 2013 | 67,695 | 1.4% |
| 2012 | 66,790 | 1.1% |
| 2011 | 66,038 | 1.4% |
| 2010 | 65,150 | - |
Race / Ethnicity in Milpitas
Milpitas is:
9.6% White with 7,503 White residents.
2.0% African American with 1,582 African American residents.
0.2% American Indian with 123 American Indian residents.
71.5% Asian with 55,890 Asian residents.
0.1% Hawaiian with 79 Hawaiian residents.
0.2% Other with 173 Other residents.
3.1% Two Or More with 2,422 Two Or More residents.
13.4% Hispanic with 10,444 Hispanic residents.
| Race | Milpitas | CA | USA |
|---|---|---|---|
| White | 9.6% | 34.6% | 58.2% |
| African American | 2.0% | 5.3% | 12.0% |
| American Indian | 0.2% | 0.3% | 0.5% |
| Asian | 71.5% | 15.1% | 5.7% |
| Hawaiian | 0.1% | 0.3% | 0.2% |
| Other | 0.2% | 0.5% | 0.5% |
| Two Or More | 3.1% | 4.1% | 3.9% |
| Hispanic | 13.4% | 39.8% | 19.0% |
Gender in Milpitas
Milpitas is 47.3% female with 36,995 female residents.
Milpitas is 52.7% male with 41,220 male residents.
| Gender | Milpitas | CA | USA |
|---|---|---|---|
| Female | 47.3% | 50.0% | 50.5% |
| Male | 52.7% | 50.0% | 49.5% |
Highest level of educational attainment in Milpitas for adults over 25
6.0% of adults in Milpitas completed < 9th grade.
5.0% of adults in Milpitas completed 9-12th grade.
13.0% of adults in Milpitas completed high school / ged.
10.0% of adults in Milpitas completed some college.
7.0% of adults in Milpitas completed associate's degree.
33.0% of adults in Milpitas completed bachelor's degree.
22.0% of adults in Milpitas completed master's degree.
1.0% of adults in Milpitas completed professional degree.
3.0% of adults in Milpitas completed doctorate degree.
| Education | Milpitas | CA | USA |
|---|---|---|---|
| < 9th Grade | 6.0% | 8.0% | 5.0% |
| 9-12th Grade | 5.0% | 7.0% | 6.0% |
| High School / GED | 13.0% | 20.0% | 26.0% |
| Some College | 10.0% | 20.0% | 19.0% |
| Associate's Degree | 7.0% | 8.0% | 9.0% |
| Bachelor's Degree | 33.0% | 22.0% | 21.0% |
| Master's Degree | 22.0% | 10.0% | 10.0% |
| Professional Degree | 1.0% | 3.0% | 2.0% |
| Doctorate Degree | 3.0% | 2.0% | 2.0% |
Household Income For Milpitas, California
3.1% of households in Milpitas earn Less than $10,000.
2.0% of households in Milpitas earn $10,000 to $14,999.
2.3% of households in Milpitas earn $15,000 to $24,999.
2.4% of households in Milpitas earn $25,000 to $34,999.
3.1% of households in Milpitas earn $35,000 to $49,999.
6.9% of households in Milpitas earn $50,000 to $74,999.
7.0% of households in Milpitas earn $75,000 to $99,999.
14.4% of households in Milpitas earn $100,000 to $149,999.
15.6% of households in Milpitas earn $150,000 to $199,999.
43.2% of households in Milpitas earn $200,000 or more.
| Income | Milpitas | CA | USA |
|---|---|---|---|
| Less than $10,000 | 3.1% | 4.4% | 4.9% |
| $10,000 to $14,999 | 2.0% | 3.0% | 3.6% |
| $15,000 to $24,999 | 2.3% | 5.2% | 6.6% |
| $25,000 to $34,999 | 2.4% | 5.5% | 6.8% |
| $35,000 to $49,999 | 3.1% | 8.4% | 10.4% |
| $50,000 to $74,999 | 6.9% | 13.3% | 15.7% |
| $75,000 to $99,999 | 7.0% | 11.8% | 12.7% |
| $100,000 to $149,999 | 14.4% | 17.9% | 17.4% |
| $150,000 to $199,999 | 15.6% | 11.1% | 9.3% |
| $200,000 or more | 43.2% | 19.4% | 12.6% |


