Loma Linda SnackAbility
Overall SnackAbility
Crime in Loma Linda summary. We use data from the FBI to determine the crime rates in Loma Linda. Key points include:
There were 473 total crimes in Loma Linda in the last reporting year.
The overall crime rate per 100,000 people in Loma Linda is 1,878.0 / 100k people.
The violent crime rate per 100,000 people in Loma Linda is 341.5 / 100k people.
The property crime rate per 100,000 people in Loma Linda is 1,536.6 / 100k people.
Overall, crime in Loma Linda is -11.38% below the national average.
Total Crimes
Below National Average
Crime In Loma Linda Comparison Table
| Statistic | Count Raw |
Loma Linda / 100k People |
California / 100k People |
National / 100k People |
|---|---|---|---|---|
| Total Crimes Per 100K | 473 | 1,878.0 | 2,564.5 | 2,119.2 |
| Violent Crime | 86 | 341.5 | 486.0 | 359.0 |
| Murder | 1 | 4.0 | 4.5 | 5.0 |
| Robbery | 15 | 59.6 | 119.1 | 61.0 |
| Aggravated Assault | 58 | 230.3 | 325.8 | 256.0 |
| Property Crime | 387 | 1,536.6 | 2,078.4 | 1,760.0 |
| Burglary | 84 | 333.5 | 305.8 | 229.0 |
| Larceny | 209 | 829.8 | 1,345.2 | 1,272.0 |
| Car Theft | 94 | 373.2 | 427.5 | 259.0 |
Source: FBI Uniform Crime Reporting (2024)
Cost of living in Loma Linda summary. We use data on the cost of living to determine how expensive it is to live in Loma Linda. Real estate prices drive most of the variance in cost of living around California. Key points include:
The cost of living in Loma Linda is 140 with 100 being average.
The cost of living in Loma Linda is 1.4x higher than the national average.
The median home value in Loma Linda is $640,816.
The median income in Loma Linda is $82,353.
Loma Linda's Overall Cost Of Living
Higher Than The National Average
Cost Of Living In Loma Linda Comparison Table
| Living Expense | Loma Linda | California | National Average |
|---|---|---|---|
| Overall | 140 | 142 | 100 |
| Services | 114 | 110 | 100 |
| Groceries | 115 | 118 | 100 |
| Health | 194 | 197 | 100 |
| Housing | 118 | 120 | 100 |
| Transportation | 124 | 121 | 100 |
| Utilities | 113 | 121 | 100 |
Source: Cost of living index, normalized to US average = 100
Loma Linda, CA Weather
The average high in Loma Linda is 76.0° and the average low is 48.8°.
There are 22.0 days of precipitation each year.
Expect an average of 14.2 inches of precipitation each year with 9.0 inches of snow.
| Stat | Loma Linda |
|---|---|
| Average Annual High | 76.0 |
| Average Annual Low | 48.8 |
| Annual Precipitation Days | 22.0 |
| Average Annual Precipitation | 14.2 |
| Average Annual Snowfall | 9.0 |
Average High
Days of Rain
Source: NOAA climate normals (30-year)
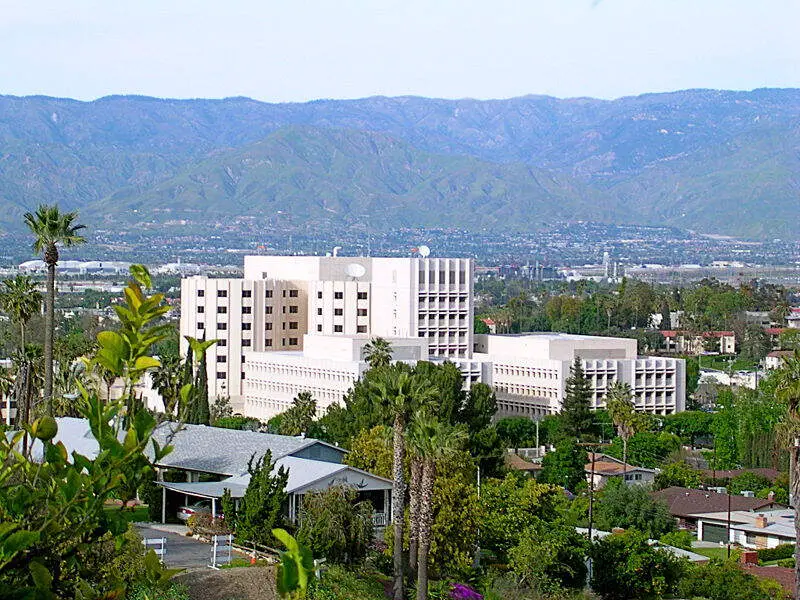
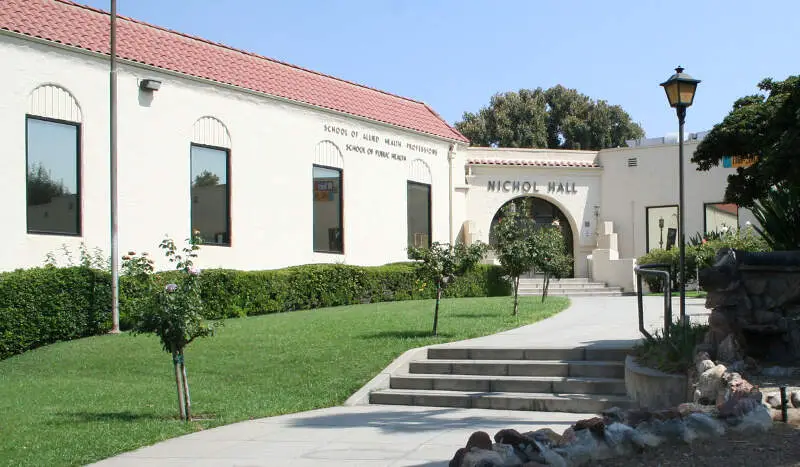
Loma Linda, CA Photos

Rankings & Articles For Loma Linda


Locations Around Loma Linda
Map Of Loma Linda, CA
Best Places Around Loma Linda
Rancho Cucamonga, CA
Population 175,411
Grand Terrace, CA
Population 13,078
Eastvale, CA
Population 70,633
Home Gardens, CA
Population 10,506
Woodcrest, CA
Population 17,368
Redlands, CA
Population 73,375
Norco, CA
Population 25,054
Fontana, CA
Population 214,169
Bloomington, CA
Population 25,698
Highland, CA
Population 56,675
Loma Linda Demographics And Statistics
Population over time in Loma Linda
The current population in Loma Linda is 25,122. The population has increased 10.0% from 2010.
| Year | Population | % Change |
|---|---|---|
| 2024 | 25,122 | 0.4% |
| 2023 | 25,021 | 0.6% |
| 2022 | 24,883 | 0.7% |
| 2021 | 24,712 | 2.0% |
| 2020 | 24,239 | 0.2% |
| 2019 | 24,184 | 0.4% |
| 2018 | 24,078 | 0.5% |
| 2017 | 23,961 | 0.4% |
| 2016 | 23,859 | 0.5% |
| 2015 | 23,751 | 0.4% |
| 2014 | 23,648 | 1.0% |
| 2013 | 23,424 | 0.8% |
| 2012 | 23,239 | 0.7% |
| 2011 | 23,081 | 1.1% |
| 2010 | 22,837 | - |
Race / Ethnicity in Loma Linda
See the full breakdown
Loma Linda is:
28.5% White with 7,159 White residents.
7.8% African American with 1,960 African American residents.
0.1% American Indian with 24 American Indian residents.
28.3% Asian with 7,097 Asian residents.
0.0% Hawaiian with 9 Hawaiian residents.
2.0% Other with 512 Other residents.
3.4% Two Or More with 863 Two Or More residents.
29.8% Hispanic with 7,498 Hispanic residents.
| Race | Loma Linda | CA | USA |
|---|---|---|---|
| White | 28.5% | 33.8% | 57.4% |
| African American | 7.8% | 5.2% | 11.9% |
| American Indian | 0.1% | 0.3% | 0.5% |
| Asian | 28.3% | 15.3% | 5.9% |
| Hawaiian | 0.0% | 0.3% | 0.2% |
| Other | 2.0% | 0.6% | 0.6% |
| Two Or More | 3.4% | 4.4% | 4.3% |
| Hispanic | 29.8% | 40.2% | 19.3% |
Gender in Loma Linda
See the full breakdown
Loma Linda is 53.6% female with 13,466 female residents.
Loma Linda is 46.4% male with 11,655 male residents.
| Gender | Loma Linda | CA | USA |
|---|---|---|---|
| Female | 53.6% | 50.1% | 50.5% |
| Male | 46.4% | 49.9% | 49.5% |
Highest level of educational attainment in Loma Linda for adults over 25
See the full breakdown
5.0% of adults in Loma Linda completed < 9th grade.
4.0% of adults in Loma Linda completed 9-12th grade.
17.0% of adults in Loma Linda completed high school / ged.
14.0% of adults in Loma Linda completed some college.
8.0% of adults in Loma Linda completed associate's degree.
26.0% of adults in Loma Linda completed bachelor's degree.
12.0% of adults in Loma Linda completed master's degree.
10.0% of adults in Loma Linda completed professional degree.
4.0% of adults in Loma Linda completed doctorate degree.
| Education | Loma Linda | CA | USA |
|---|---|---|---|
| < 9th Grade | 5.0% | 8.0% | 4.0% |
| 9-12th Grade | 4.0% | 7.0% | 6.0% |
| High School / GED | 17.0% | 20.0% | 26.0% |
| Some College | 14.0% | 19.0% | 19.0% |
| Associate's Degree | 8.0% | 8.0% | 9.0% |
| Bachelor's Degree | 26.0% | 23.0% | 22.0% |
| Master's Degree | 12.0% | 10.0% | 10.0% |
| Professional Degree | 10.0% | 3.0% | 2.0% |
| Doctorate Degree | 4.0% | 2.0% | 2.0% |
Household Income For Loma Linda, California
See the full breakdown
8.4% of households in Loma Linda earn Less than $10,000.
1.8% of households in Loma Linda earn $10,000 to $14,999.
5.0% of households in Loma Linda earn $15,000 to $24,999.
6.2% of households in Loma Linda earn $25,000 to $34,999.
9.9% of households in Loma Linda earn $35,000 to $49,999.
12.4% of households in Loma Linda earn $50,000 to $74,999.
13.7% of households in Loma Linda earn $75,000 to $99,999.
20.0% of households in Loma Linda earn $100,000 to $149,999.
7.7% of households in Loma Linda earn $150,000 to $199,999.
15.1% of households in Loma Linda earn $200,000 or more.
| Income | Loma Linda | CA | USA |
|---|---|---|---|
| Less than $10,000 | 8.4% | 4.5% | 5.0% |
| $10,000 to $14,999 | 1.8% | 2.9% | 3.4% |
| $15,000 to $24,999 | 5.0% | 5.0% | 6.3% |
| $25,000 to $34,999 | 6.2% | 5.3% | 6.6% |
| $35,000 to $49,999 | 9.9% | 8.1% | 10.1% |
| $50,000 to $74,999 | 12.4% | 13.0% | 15.5% |
| $75,000 to $99,999 | 13.7% | 11.6% | 12.6% |
| $100,000 to $149,999 | 20.0% | 17.8% | 17.5% |
| $150,000 to $199,999 | 7.7% | 11.3% | 9.6% |
| $200,000 or more | 15.1% | 20.5% | 13.4% |
Source: U.S. Census ACS 5-year estimates (2024)


