Redlands SnackAbility
Overall SnackAbility
Crime in Redlands summary. We use data from the FBI to determine the crime rates in Redlands. Key points include:
There were 1,772 total crimes in Redlands in the last reporting year.
The overall crime rate per 100,000 people in Redlands is 2,449.8 / 100k people.
The violent crime rate per 100,000 people in Redlands is 298.6 / 100k people.
The property crime rate per 100,000 people in Redlands is 2,151.2 / 100k people.
Overall, crime in Redlands is 15.60% above the national average.
Total Crimes
Above National Average
Crime In Redlands Comparison Table
| Statistic | Count Raw |
Redlands / 100k People |
California / 100k People |
National / 100k People |
|---|---|---|---|---|
| Total Crimes Per 100K | 1,772 | 2,449.8 | 2,564.5 | 2,119.2 |
| Violent Crime | 216 | 298.6 | 486.0 | 359.0 |
| Murder | 3 | 4.1 | 4.5 | 5.0 |
| Robbery | 53 | 73.3 | 119.1 | 61.0 |
| Aggravated Assault | 125 | 172.8 | 325.8 | 256.0 |
| Property Crime | 1,556 | 2,151.2 | 2,078.4 | 1,760.0 |
| Burglary | 196 | 271.0 | 305.8 | 229.0 |
| Larceny | 1,114 | 1,540.1 | 1,345.2 | 1,272.0 |
| Car Theft | 246 | 340.1 | 427.5 | 259.0 |
Source: FBI Uniform Crime Reporting (2024)
Cost of living in Redlands summary. We use data on the cost of living to determine how expensive it is to live in Redlands. Real estate prices drive most of the variance in cost of living around California. Key points include:
The cost of living in Redlands is 145 with 100 being average.
The cost of living in Redlands is 1.4x higher than the national average.
The median home value in Redlands is $636,035.
The median income in Redlands is $105,041.
Redlands's Overall Cost Of Living
Higher Than The National Average
Cost Of Living In Redlands Comparison Table
| Living Expense | Redlands | California | National Average |
|---|---|---|---|
| Overall | 145 | 142 | 100 |
| Services | 110 | 110 | 100 |
| Groceries | 117 | 118 | 100 |
| Health | 209 | 197 | 100 |
| Housing | 115 | 120 | 100 |
| Transportation | 122 | 121 | 100 |
| Utilities | 121 | 121 | 100 |
Source: Cost of living index, normalized to US average = 100
Redlands, CA Weather
The average high in Redlands is 76.0° and the average low is 48.8°.
There are 22.0 days of precipitation each year.
Expect an average of 14.2 inches of precipitation each year with 9.0 inches of snow.
| Stat | Redlands |
|---|---|
| Average Annual High | 76.0 |
| Average Annual Low | 48.8 |
| Annual Precipitation Days | 22.0 |
| Average Annual Precipitation | 14.2 |
| Average Annual Snowfall | 9.0 |
Average High
Days of Rain
Source: NOAA climate normals (30-year)
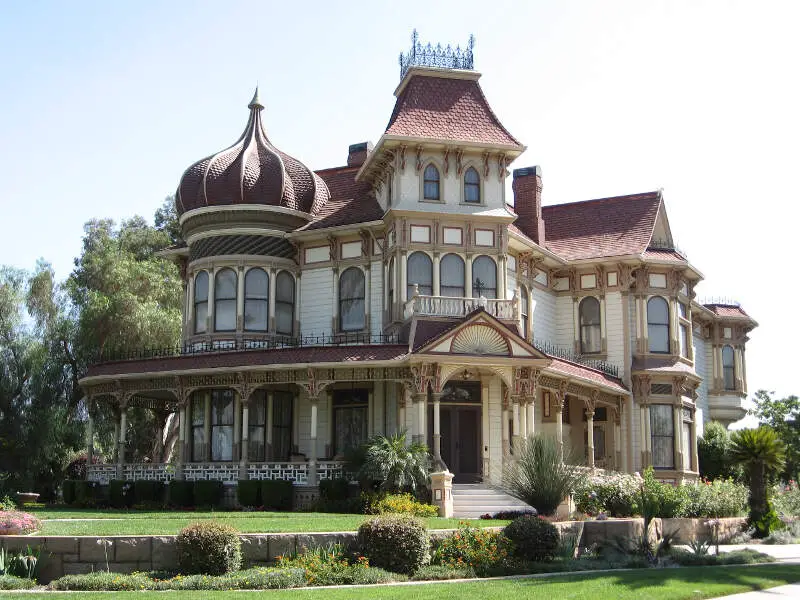
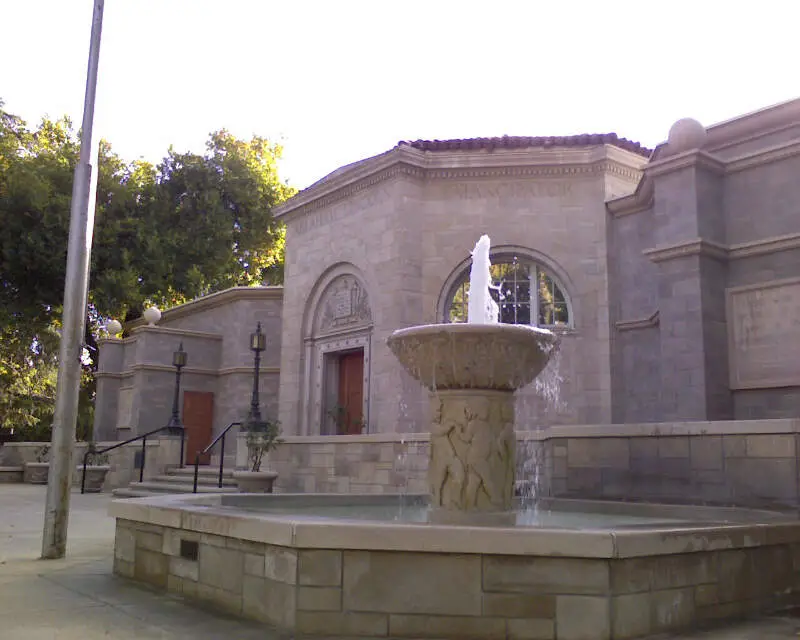
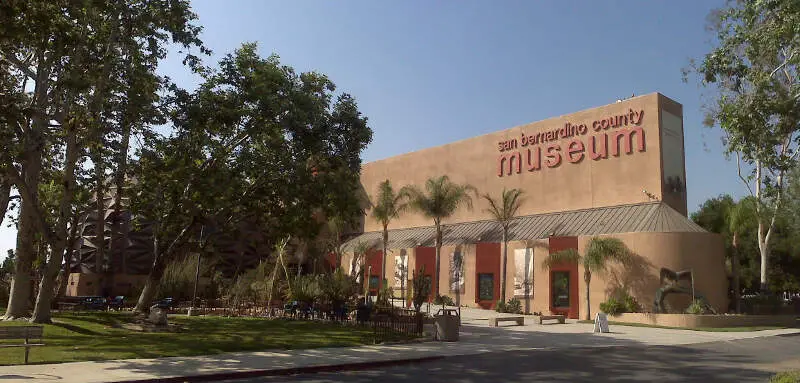
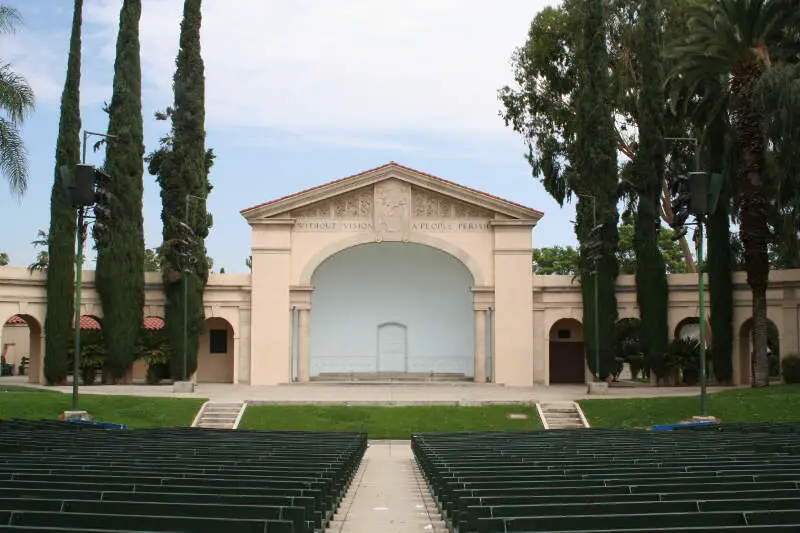
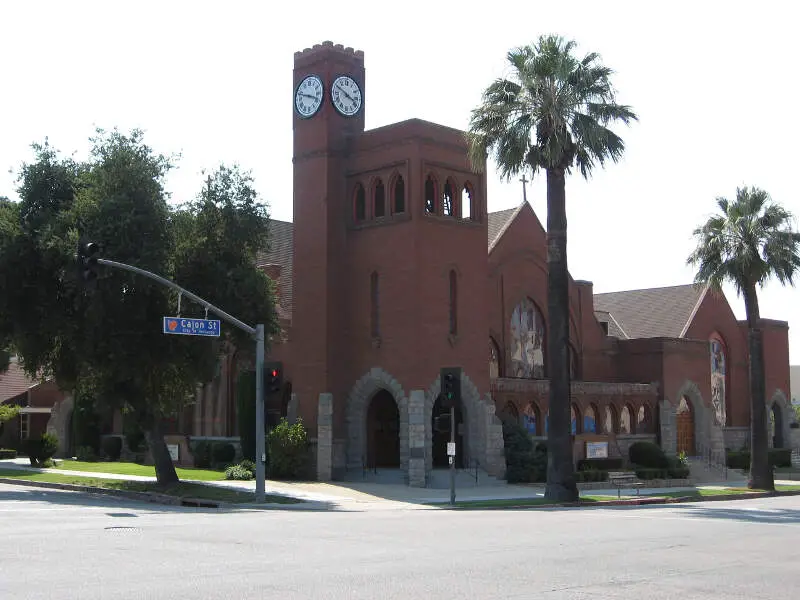
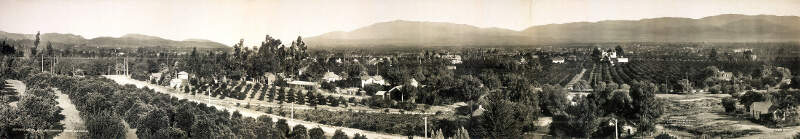
Redlands, CA Photos


Rankings & Articles For Redlands


Locations Around Redlands
Map Of Redlands, CA
Best Places Around Redlands
Grand Terrace, CA
Population 13,078
Woodcrest, CA
Population 17,368
Loma Linda, CA
Population 25,122
Fontana, CA
Population 214,169
Bloomington, CA
Population 25,698
Highland, CA
Population 56,675
Yucaipa, CA
Population 54,421
Cherry Valley, CA
Population 6,668
Mentone, CA
Population 9,514
Nuevo, CA
Population 6,803
Redlands Demographics And Statistics
Population over time in Redlands
The current population in Redlands is 73,375. The population has increased 6.6% from 2010.
| Year | Population | % Change |
|---|---|---|
| 2024 | 73,375 | 0.5% |
| 2023 | 72,985 | -0.3% |
| 2022 | 73,234 | 0.8% |
| 2021 | 72,649 | 1.4% |
| 2020 | 71,680 | 0.7% |
| 2019 | 71,198 | 0.3% |
| 2018 | 71,012 | 0.3% |
| 2017 | 70,765 | 0.5% |
| 2016 | 70,442 | 0.4% |
| 2015 | 70,186 | 0.6% |
| 2014 | 69,787 | 0.7% |
| 2013 | 69,277 | 0.3% |
| 2012 | 69,078 | 0.1% |
| 2011 | 68,995 | 0.2% |
| 2010 | 68,852 | - |
Race / Ethnicity in Redlands
See the full breakdown
Redlands is:
40.6% White with 29,819 White residents.
5.6% African American with 4,093 African American residents.
0.2% American Indian with 174 American Indian residents.
8.2% Asian with 6,037 Asian residents.
0.3% Hawaiian with 231 Hawaiian residents.
0.3% Other with 186 Other residents.
5.3% Two Or More with 3,865 Two Or More residents.
39.5% Hispanic with 28,970 Hispanic residents.
| Race | Redlands | CA | USA |
|---|---|---|---|
| White | 40.6% | 33.8% | 57.4% |
| African American | 5.6% | 5.2% | 11.9% |
| American Indian | 0.2% | 0.3% | 0.5% |
| Asian | 8.2% | 15.3% | 5.9% |
| Hawaiian | 0.3% | 0.3% | 0.2% |
| Other | 0.3% | 0.6% | 0.6% |
| Two Or More | 5.3% | 4.4% | 4.3% |
| Hispanic | 39.5% | 40.2% | 19.3% |
Gender in Redlands
See the full breakdown
Redlands is 52.2% female with 38,335 female residents.
Redlands is 47.8% male with 35,040 male residents.
| Gender | Redlands | CA | USA |
|---|---|---|---|
| Female | 52.2% | 50.1% | 50.5% |
| Male | 47.8% | 49.9% | 49.5% |
Highest level of educational attainment in Redlands for adults over 25
See the full breakdown
3.0% of adults in Redlands completed < 9th grade.
5.0% of adults in Redlands completed 9-12th grade.
22.0% of adults in Redlands completed high school / ged.
20.0% of adults in Redlands completed some college.
8.0% of adults in Redlands completed associate's degree.
20.0% of adults in Redlands completed bachelor's degree.
14.0% of adults in Redlands completed master's degree.
5.0% of adults in Redlands completed professional degree.
3.0% of adults in Redlands completed doctorate degree.
| Education | Redlands | CA | USA |
|---|---|---|---|
| < 9th Grade | 3.0% | 8.0% | 4.0% |
| 9-12th Grade | 5.0% | 7.0% | 6.0% |
| High School / GED | 22.0% | 20.0% | 26.0% |
| Some College | 20.0% | 19.0% | 19.0% |
| Associate's Degree | 8.0% | 8.0% | 9.0% |
| Bachelor's Degree | 20.0% | 23.0% | 22.0% |
| Master's Degree | 14.0% | 10.0% | 10.0% |
| Professional Degree | 5.0% | 3.0% | 2.0% |
| Doctorate Degree | 3.0% | 2.0% | 2.0% |
Household Income For Redlands, California
See the full breakdown
3.3% of households in Redlands earn Less than $10,000.
2.3% of households in Redlands earn $10,000 to $14,999.
4.6% of households in Redlands earn $15,000 to $24,999.
4.0% of households in Redlands earn $25,000 to $34,999.
6.0% of households in Redlands earn $35,000 to $49,999.
12.9% of households in Redlands earn $50,000 to $74,999.
14.1% of households in Redlands earn $75,000 to $99,999.
23.0% of households in Redlands earn $100,000 to $149,999.
13.0% of households in Redlands earn $150,000 to $199,999.
16.7% of households in Redlands earn $200,000 or more.
| Income | Redlands | CA | USA |
|---|---|---|---|
| Less than $10,000 | 3.3% | 4.5% | 5.0% |
| $10,000 to $14,999 | 2.3% | 2.9% | 3.4% |
| $15,000 to $24,999 | 4.6% | 5.0% | 6.3% |
| $25,000 to $34,999 | 4.0% | 5.3% | 6.6% |
| $35,000 to $49,999 | 6.0% | 8.1% | 10.1% |
| $50,000 to $74,999 | 12.9% | 13.0% | 15.5% |
| $75,000 to $99,999 | 14.1% | 11.6% | 12.6% |
| $100,000 to $149,999 | 23.0% | 17.8% | 17.5% |
| $150,000 to $199,999 | 13.0% | 11.3% | 9.6% |
| $200,000 or more | 16.7% | 20.5% | 13.4% |
Source: U.S. Census ACS 5-year estimates (2024)


