Mill Valley SnackAbility
Overall SnackAbility
Crime in Mill Valley summary. We use data from the FBI to determine the crime rates in Mill Valley. Key points include:
There were 150 total crimes in Mill Valley in the last reporting year.
The overall crime rate per 100,000 people in Mill Valley is 1,098.3 / 100k people.
The violent crime rate per 100,000 people in Mill Valley is 95.2 / 100k people.
The property crime rate per 100,000 people in Mill Valley is 1,003.1 / 100k people.
Overall, crime in Mill Valley is -48.18% below the national average.
Total Crimes
Below National Average
Crime In Mill Valley Comparison Table
| Statistic | Count Raw |
Mill Valley / 100k People |
California / 100k People |
National / 100k People |
|---|---|---|---|---|
| Total Crimes Per 100K | 150 | 1,098.3 | 2,564.5 | 2,119.2 |
| Violent Crime | 13 | 95.2 | 486.0 | 359.0 |
| Murder | 0 | 0.0 | 4.5 | 5.0 |
| Robbery | 4 | 29.3 | 119.1 | 61.0 |
| Aggravated Assault | 9 | 65.9 | 325.8 | 256.0 |
| Property Crime | 137 | 1,003.1 | 2,078.4 | 1,760.0 |
| Burglary | 25 | 183.0 | 305.8 | 229.0 |
| Larceny | 108 | 790.7 | 1,345.2 | 1,272.0 |
| Car Theft | 4 | 29.3 | 427.5 | 259.0 |
Source: FBI Uniform Crime Reporting (2024)
Cost of living in Mill Valley summary. We use data on the cost of living to determine how expensive it is to live in Mill Valley. Real estate prices drive most of the variance in cost of living around California. Key points include:
The cost of living in Mill Valley is 293 with 100 being average.
The cost of living in Mill Valley is 2.9x higher than the national average.
The median home value in Mill Valley is $2,073,166.
The median income in Mill Valley is $206,212.
Mill Valley's Overall Cost Of Living
Higher Than The National Average
Cost Of Living In Mill Valley Comparison Table
| Living Expense | Mill Valley | California | National Average |
|---|---|---|---|
| Overall | 293 | 142 | 100 |
| Services | 110 | 110 | 100 |
| Groceries | 114 | 118 | 100 |
| Health | 703 | 197 | 100 |
| Housing | 121 | 120 | 100 |
| Transportation | 117 | 121 | 100 |
| Utilities | 115 | 121 | 100 |
Source: Cost of living index, normalized to US average = 100
Mill Valley, CA Weather
The average high in Mill Valley is 67.1° and the average low is 48.0°.
There are 49.9 days of precipitation each year.
Expect an average of 36.2 inches of precipitation each year with 0.0 inches of snow.
| Stat | Mill Valley |
|---|---|
| Average Annual High | 67.1 |
| Average Annual Low | 48.0 |
| Annual Precipitation Days | 49.9 |
| Average Annual Precipitation | 36.2 |
| Average Annual Snowfall | 0.0 |
Average High
Days of Rain
Source: NOAA climate normals (30-year)
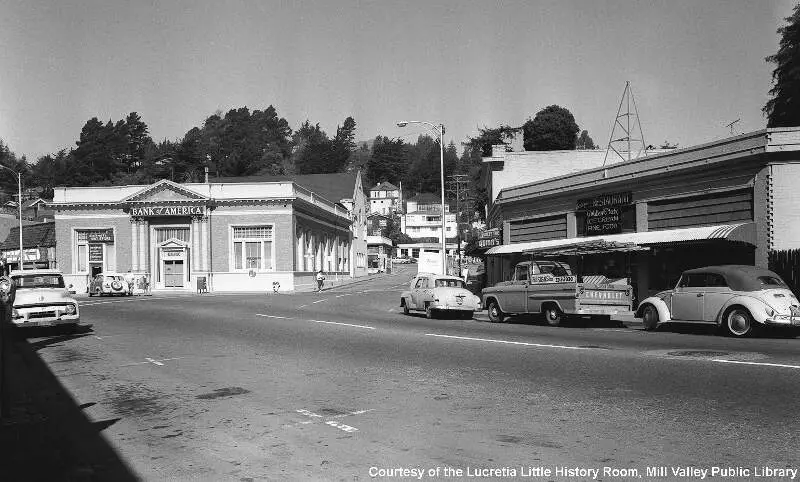
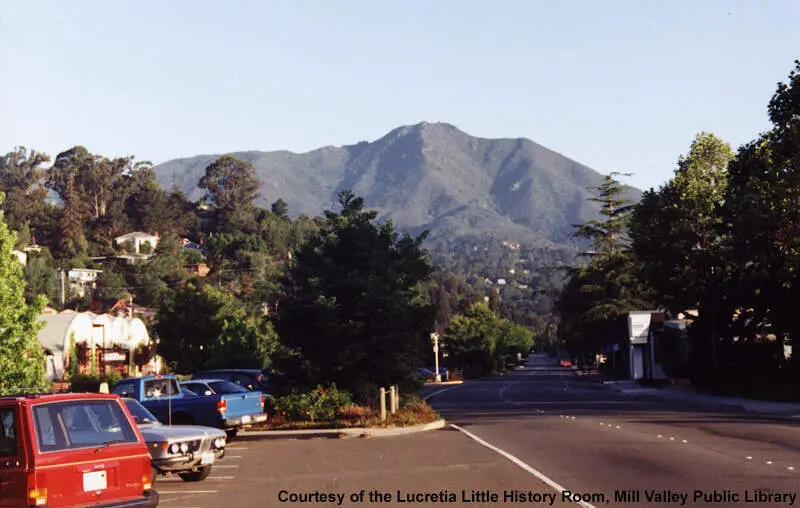
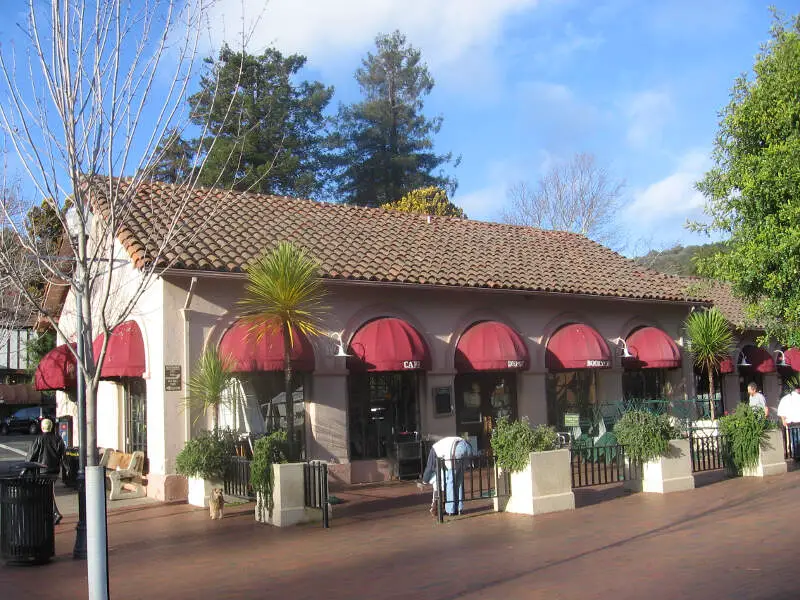
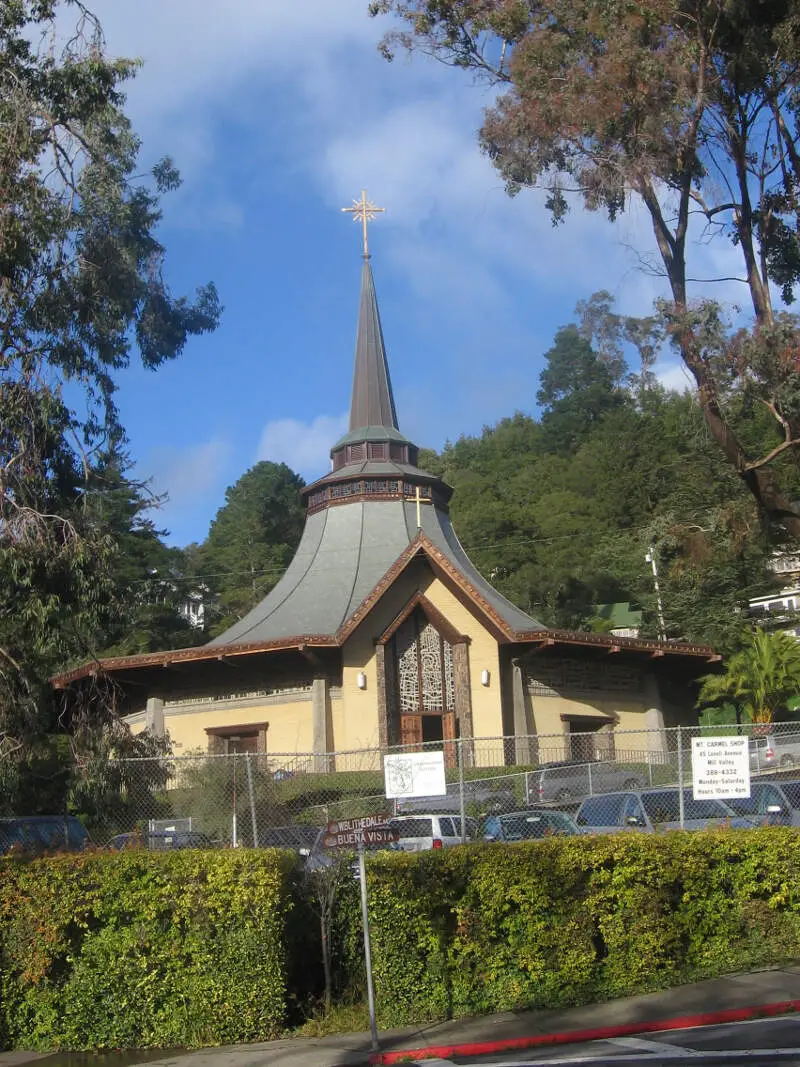
Mill Valley, CA Photos


1 Reviews & Comments About Mill Valley

OMG I live in MILL VALLEY!!!! Lol. We are pretty s****y, but if you're s****y, you must have a reason why. It's so pretty here! And most people are really nice too.
Rankings & Articles For Mill Valley


Locations Around Mill Valley
Map Of Mill Valley, CA
Best Places Around Mill Valley
Piedmont, CA
Population 10,945
Kensington, CA
Population 5,179
Lucas Valley-Marinwood, CA
Population 6,473
Fairfax, CA
Population 7,516
South San Francisco, CA
Population 64,305
Kentfield, CA
Population 6,900
Hercules, CA
Population 26,302
San Anselmo, CA
Population 12,679
Larkspur, CA
Population 12,854
Corte Madera, CA
Population 10,077
Mill Valley Demographics And Statistics
Population over time in Mill Valley
The current population in Mill Valley is 14,012. The population has increased 2.3% from 2010.
| Year | Population | % Change |
|---|---|---|
| 2024 | 14,012 | -0.4% |
| 2023 | 14,064 | -1.0% |
| 2022 | 14,199 | -0.3% |
| 2021 | 14,240 | -1.5% |
| 2020 | 14,456 | 0.9% |
| 2019 | 14,330 | -0.1% |
| 2018 | 14,343 | -0.3% |
| 2017 | 14,392 | 0.5% |
| 2016 | 14,318 | 0.5% |
| 2015 | 14,243 | 0.5% |
| 2014 | 14,178 | 0.9% |
| 2013 | 14,046 | 0.8% |
| 2012 | 13,931 | 0.9% |
| 2011 | 13,810 | 0.8% |
| 2010 | 13,702 | - |
Race / Ethnicity in Mill Valley
See the full breakdown
Mill Valley is:
80.1% White with 11,224 White residents.
0.7% African American with 99 African American residents.
0.0% American Indian with 0 American Indian residents.
8.3% Asian with 1,165 Asian residents.
0.0% Hawaiian with 0 Hawaiian residents.
1.2% Other with 165 Other residents.
4.9% Two Or More with 691 Two Or More residents.
4.8% Hispanic with 668 Hispanic residents.
| Race | Mill Valley | CA | USA |
|---|---|---|---|
| White | 80.1% | 33.8% | 57.4% |
| African American | 0.7% | 5.2% | 11.9% |
| American Indian | 0.0% | 0.3% | 0.5% |
| Asian | 8.3% | 15.3% | 5.9% |
| Hawaiian | 0.0% | 0.3% | 0.2% |
| Other | 1.2% | 0.6% | 0.6% |
| Two Or More | 4.9% | 4.4% | 4.3% |
| Hispanic | 4.8% | 40.2% | 19.3% |
Gender in Mill Valley
See the full breakdown
Mill Valley is 51.9% female with 7,270 female residents.
Mill Valley is 48.1% male with 6,741 male residents.
| Gender | Mill Valley | CA | USA |
|---|---|---|---|
| Female | 51.9% | 50.1% | 50.5% |
| Male | 48.1% | 49.9% | 49.5% |
Highest level of educational attainment in Mill Valley for adults over 25
See the full breakdown
1.0% of adults in Mill Valley completed < 9th grade.
0.0% of adults in Mill Valley completed 9-12th grade.
7.0% of adults in Mill Valley completed high school / ged.
11.0% of adults in Mill Valley completed some college.
5.0% of adults in Mill Valley completed associate's degree.
40.0% of adults in Mill Valley completed bachelor's degree.
22.0% of adults in Mill Valley completed master's degree.
11.0% of adults in Mill Valley completed professional degree.
3.0% of adults in Mill Valley completed doctorate degree.
| Education | Mill Valley | CA | USA |
|---|---|---|---|
| < 9th Grade | 1.0% | 8.0% | 4.0% |
| 9-12th Grade | 0.0% | 7.0% | 6.0% |
| High School / GED | 7.0% | 20.0% | 26.0% |
| Some College | 11.0% | 19.0% | 19.0% |
| Associate's Degree | 5.0% | 8.0% | 9.0% |
| Bachelor's Degree | 40.0% | 23.0% | 22.0% |
| Master's Degree | 22.0% | 10.0% | 10.0% |
| Professional Degree | 11.0% | 3.0% | 2.0% |
| Doctorate Degree | 3.0% | 2.0% | 2.0% |
Household Income For Mill Valley, California
See the full breakdown
4.7% of households in Mill Valley earn Less than $10,000.
1.2% of households in Mill Valley earn $10,000 to $14,999.
1.7% of households in Mill Valley earn $15,000 to $24,999.
1.5% of households in Mill Valley earn $25,000 to $34,999.
4.4% of households in Mill Valley earn $35,000 to $49,999.
6.7% of households in Mill Valley earn $50,000 to $74,999.
5.3% of households in Mill Valley earn $75,000 to $99,999.
14.2% of households in Mill Valley earn $100,000 to $149,999.
7.1% of households in Mill Valley earn $150,000 to $199,999.
53.3% of households in Mill Valley earn $200,000 or more.
| Income | Mill Valley | CA | USA |
|---|---|---|---|
| Less than $10,000 | 4.7% | 4.5% | 5.0% |
| $10,000 to $14,999 | 1.2% | 2.9% | 3.4% |
| $15,000 to $24,999 | 1.7% | 5.0% | 6.3% |
| $25,000 to $34,999 | 1.5% | 5.3% | 6.6% |
| $35,000 to $49,999 | 4.4% | 8.1% | 10.1% |
| $50,000 to $74,999 | 6.7% | 13.0% | 15.5% |
| $75,000 to $99,999 | 5.3% | 11.6% | 12.6% |
| $100,000 to $149,999 | 14.2% | 17.8% | 17.5% |
| $150,000 to $199,999 | 7.1% | 11.3% | 9.6% |
| $200,000 or more | 53.3% | 20.5% | 13.4% |
Source: U.S. Census ACS 5-year estimates (2024)


