San Anselmo SnackAbility
Overall SnackAbility
Cost of living in San Anselmo summary. We use data on the cost of living to determine how expensive it is to live in San Anselmo. Real estate prices drive most of the variance in cost of living around California. Key points include:
The cost of living in San Anselmo is 235 with 100 being average.
The cost of living in San Anselmo is 2.4x higher than the national average.
The median home value in San Anselmo is $1,647,301.
The median income in San Anselmo is $173,641.
San Anselmo's Overall Cost Of Living
Higher Than The National Average
Cost Of Living In San Anselmo Comparison Table
| Living Expense | San Anselmo | California | National Average |
|---|---|---|---|
| Overall | 235 | 142 | 100 |
| Services | 110 | 110 | 100 |
| Groceries | 111 | 118 | 100 |
| Health | 521 | 197 | 100 |
| Housing | 118 | 120 | 100 |
| Transportation | 118 | 121 | 100 |
| Utilities | 115 | 121 | 100 |
Source: Cost of living index, normalized to US average = 100
San Anselmo, CA Weather
The average high in San Anselmo is 67.1° and the average low is 48.0°.
There are 49.9 days of precipitation each year.
Expect an average of 36.2 inches of precipitation each year with 0.0 inches of snow.
| Stat | San Anselmo |
|---|---|
| Average Annual High | 67.1 |
| Average Annual Low | 48.0 |
| Annual Precipitation Days | 49.9 |
| Average Annual Precipitation | 36.2 |
| Average Annual Snowfall | 0.0 |
Average High
Days of Rain
Source: NOAA climate normals (30-year)
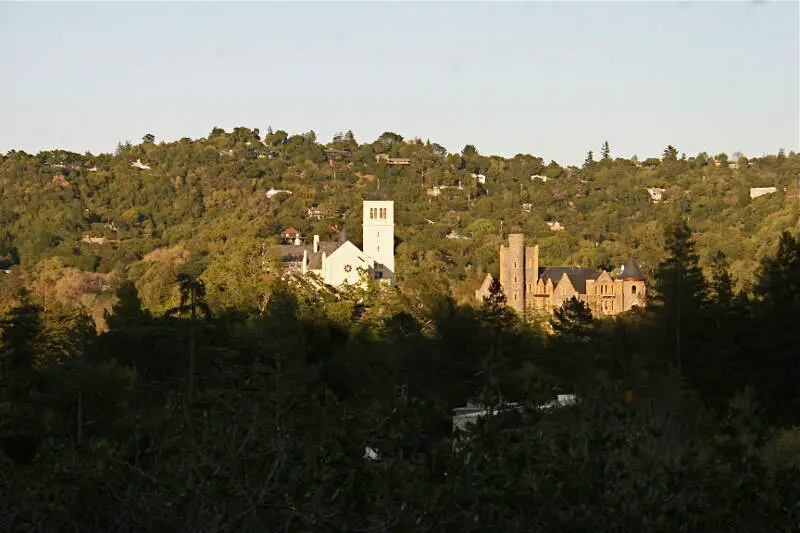
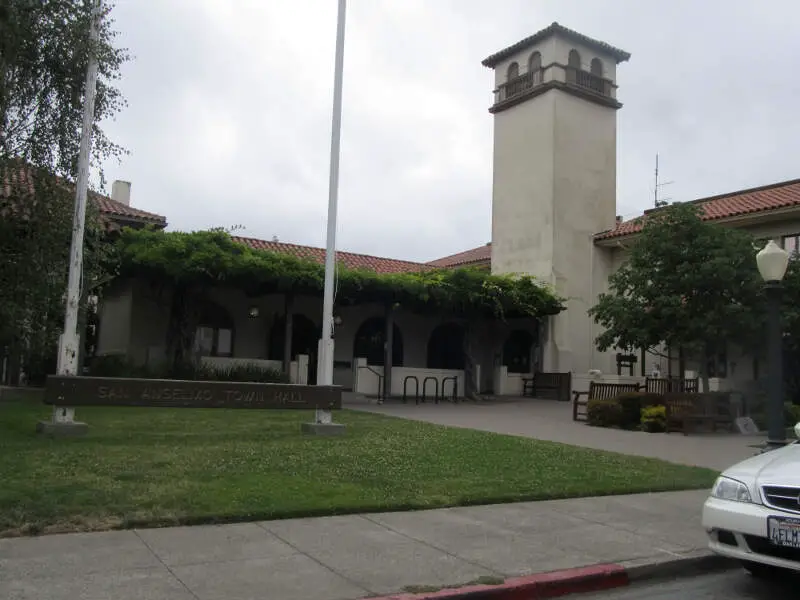
San Anselmo, CA Photos
Rankings & Articles For San Anselmo


Locations Around San Anselmo
Map Of San Anselmo, CA
Best Places Around San Anselmo
Kensington, CA
Population 5,179
Lucas Valley-Marinwood, CA
Population 6,473
Fairfax, CA
Population 7,516
Kentfield, CA
Population 6,900
Hercules, CA
Population 26,302
Petaluma, CA
Population 59,247
Larkspur, CA
Population 12,854
Mill Valley, CA
Population 14,012
Corte Madera, CA
Population 10,077
Tamalpais-Homestead Valley, CA
Population 12,085
San Anselmo Demographics And Statistics
Population over time in San Anselmo
The current population in San Anselmo is 12,679. The population has increased 3.9% from 2010.
| Year | Population | % Change |
|---|---|---|
| 2024 | 12,679 | -0.3% |
| 2023 | 12,711 | -0.4% |
| 2022 | 12,761 | -0.3% |
| 2021 | 12,795 | 1.4% |
| 2020 | 12,623 | 0.8% |
| 2019 | 12,525 | -0.3% |
| 2018 | 12,567 | -0.4% |
| 2017 | 12,619 | -0.0% |
| 2016 | 12,623 | 0.5% |
| 2015 | 12,566 | 0.3% |
| 2014 | 12,527 | 0.8% |
| 2013 | 12,431 | 0.6% |
| 2012 | 12,363 | 0.7% |
| 2011 | 12,273 | 0.6% |
| 2010 | 12,203 | - |
Race / Ethnicity in San Anselmo
See the full breakdown
San Anselmo is:
74.2% White with 9,411 White residents.
1.4% African American with 174 African American residents.
0.0% American Indian with 0 American Indian residents.
6.1% Asian with 774 Asian residents.
0.1% Hawaiian with 9 Hawaiian residents.
0.5% Other with 63 Other residents.
7.3% Two Or More with 921 Two Or More residents.
10.5% Hispanic with 1,327 Hispanic residents.
| Race | San Anselmo | CA | USA |
|---|---|---|---|
| White | 74.2% | 33.8% | 57.4% |
| African American | 1.4% | 5.2% | 11.9% |
| American Indian | 0.0% | 0.3% | 0.5% |
| Asian | 6.1% | 15.3% | 5.9% |
| Hawaiian | 0.1% | 0.3% | 0.2% |
| Other | 0.5% | 0.6% | 0.6% |
| Two Or More | 7.3% | 4.4% | 4.3% |
| Hispanic | 10.5% | 40.2% | 19.3% |
Gender in San Anselmo
See the full breakdown
San Anselmo is 51.3% female with 6,506 female residents.
San Anselmo is 48.7% male with 6,172 male residents.
| Gender | San Anselmo | CA | USA |
|---|---|---|---|
| Female | 51.3% | 50.1% | 50.5% |
| Male | 48.7% | 49.9% | 49.5% |
Highest level of educational attainment in San Anselmo for adults over 25
See the full breakdown
-0.0% of adults in San Anselmo completed < 9th grade.
1.0% of adults in San Anselmo completed 9-12th grade.
8.0% of adults in San Anselmo completed high school / ged.
13.0% of adults in San Anselmo completed some college.
7.0% of adults in San Anselmo completed associate's degree.
40.0% of adults in San Anselmo completed bachelor's degree.
22.0% of adults in San Anselmo completed master's degree.
6.0% of adults in San Anselmo completed professional degree.
3.0% of adults in San Anselmo completed doctorate degree.
| Education | San Anselmo | CA | USA |
|---|---|---|---|
| < 9th Grade | -0.0% | 8.0% | 4.0% |
| 9-12th Grade | 1.0% | 7.0% | 6.0% |
| High School / GED | 8.0% | 20.0% | 26.0% |
| Some College | 13.0% | 19.0% | 19.0% |
| Associate's Degree | 7.0% | 8.0% | 9.0% |
| Bachelor's Degree | 40.0% | 23.0% | 22.0% |
| Master's Degree | 22.0% | 10.0% | 10.0% |
| Professional Degree | 6.0% | 3.0% | 2.0% |
| Doctorate Degree | 3.0% | 2.0% | 2.0% |
Household Income For San Anselmo, California
See the full breakdown
5.2% of households in San Anselmo earn Less than $10,000.
0.8% of households in San Anselmo earn $10,000 to $14,999.
3.4% of households in San Anselmo earn $15,000 to $24,999.
4.9% of households in San Anselmo earn $25,000 to $34,999.
2.6% of households in San Anselmo earn $35,000 to $49,999.
6.5% of households in San Anselmo earn $50,000 to $74,999.
8.1% of households in San Anselmo earn $75,000 to $99,999.
12.7% of households in San Anselmo earn $100,000 to $149,999.
12.5% of households in San Anselmo earn $150,000 to $199,999.
43.4% of households in San Anselmo earn $200,000 or more.
| Income | San Anselmo | CA | USA |
|---|---|---|---|
| Less than $10,000 | 5.2% | 4.5% | 5.0% |
| $10,000 to $14,999 | 0.8% | 2.9% | 3.4% |
| $15,000 to $24,999 | 3.4% | 5.0% | 6.3% |
| $25,000 to $34,999 | 4.9% | 5.3% | 6.6% |
| $35,000 to $49,999 | 2.6% | 8.1% | 10.1% |
| $50,000 to $74,999 | 6.5% | 13.0% | 15.5% |
| $75,000 to $99,999 | 8.1% | 11.6% | 12.6% |
| $100,000 to $149,999 | 12.7% | 17.8% | 17.5% |
| $150,000 to $199,999 | 12.5% | 11.3% | 9.6% |
| $200,000 or more | 43.4% | 20.5% | 13.4% |
Source: U.S. Census ACS 5-year estimates (2024)


