Compare Palm Springs to…
Palm Springs SnackAbility
Overall SnackAbility
Crime in Palm Springs summary. We use data from the FBI to determine the crime rates in Palm Springs. Key points include:
There were 1,733 total crimes in Palm Springs in the last reporting year.
The overall crime rate per 100,000 people in Palm Springs is 3,816.7 / 100k people.
The violent crime rate per 100,000 people in Palm Springs is 603.4 / 100k people.
The property crime rate per 100,000 people in Palm Springs is 3,213.2 / 100k people.
Overall, crime in Palm Springs is 80.10% above the national average.
Total Crimes
Above National Average
Crime In Palm Springs Comparison Table
| Statistic | Count Raw |
Palm Springs / 100k People |
California / 100k People |
National / 100k People |
|---|---|---|---|---|
| Total Crimes Per 100K | 1,733 | 3,816.7 | 2,564.5 | 2,119.2 |
| Violent Crime | 274 | 603.4 | 486.0 | 359.0 |
| Murder | 5 | 11.0 | 4.5 | 5.0 |
| Robbery | 67 | 147.6 | 119.1 | 61.0 |
| Aggravated Assault | 171 | 376.6 | 325.8 | 256.0 |
| Property Crime | 1,459 | 3,213.2 | 2,078.4 | 1,760.0 |
| Burglary | 175 | 385.4 | 305.8 | 229.0 |
| Larceny | 1,069 | 2,354.3 | 1,345.2 | 1,272.0 |
| Car Theft | 215 | 473.5 | 427.5 | 259.0 |
Source: FBI Uniform Crime Reporting (2024)
Cost of living in Palm Springs summary. We use data on the cost of living to determine how expensive it is to live in Palm Springs. Real estate prices drive most of the variance in cost of living around California. Key points include:
The cost of living in Palm Springs is 140 with 100 being average.
The cost of living in Palm Springs is 1.4x higher than the national average.
The median home value in Palm Springs is $624,876.
The median income in Palm Springs is $73,119.
Palm Springs's Overall Cost Of Living
Higher Than The National Average
Cost Of Living In Palm Springs Comparison Table
| Living Expense | Palm Springs | California | National Average |
|---|---|---|---|
| Overall | 140 | 142 | 100 |
| Services | 107 | 110 | 100 |
| Groceries | 113 | 118 | 100 |
| Health | 193 | 197 | 100 |
| Housing | 117 | 120 | 100 |
| Transportation | 113 | 121 | 100 |
| Utilities | 118 | 121 | 100 |
Source: Cost of living index, normalized to US average = 100
Palm Springs, CA Weather
The average high in Palm Springs is 81.2° and the average low is 52.0°.
There are 18.0 days of precipitation each year.
Expect an average of 10.0 inches of precipitation each year with 1.7 inches of snow.
| Stat | Palm Springs |
|---|---|
| Average Annual High | 81.2 |
| Average Annual Low | 52.0 |
| Annual Precipitation Days | 18.0 |
| Average Annual Precipitation | 10.0 |
| Average Annual Snowfall | 1.7 |
Average High
Days of Rain
Source: NOAA climate normals (30-year)
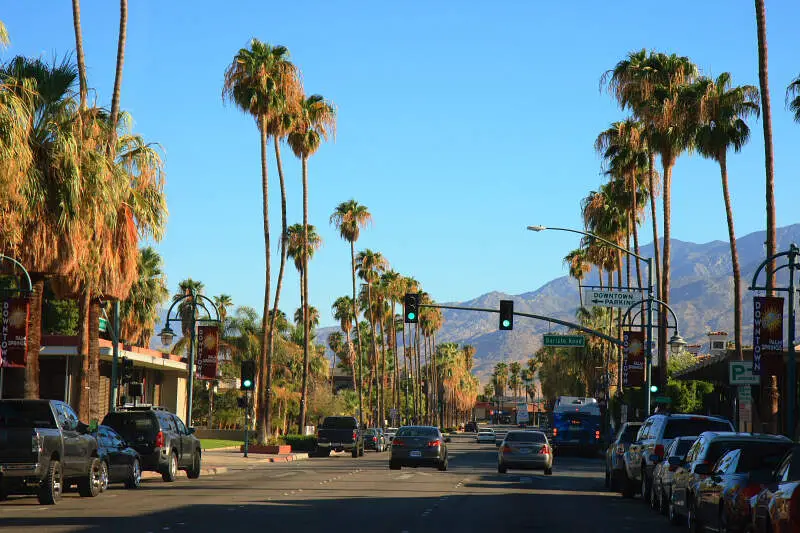
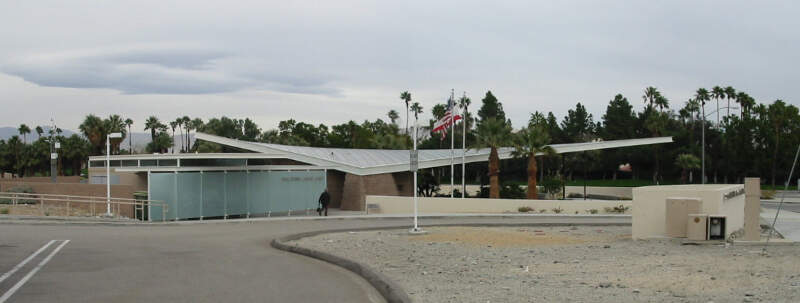
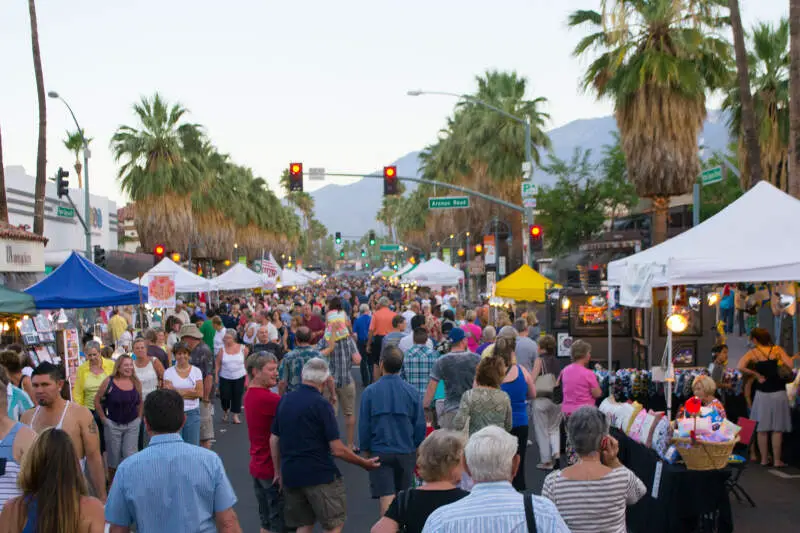
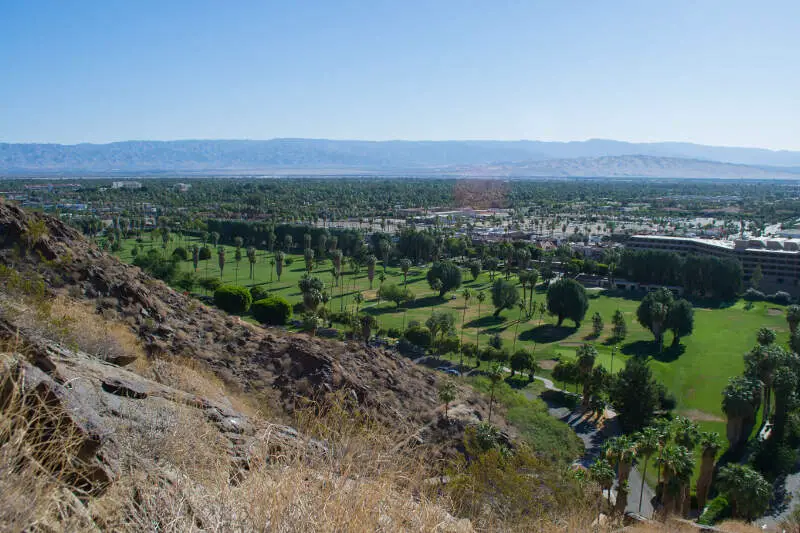
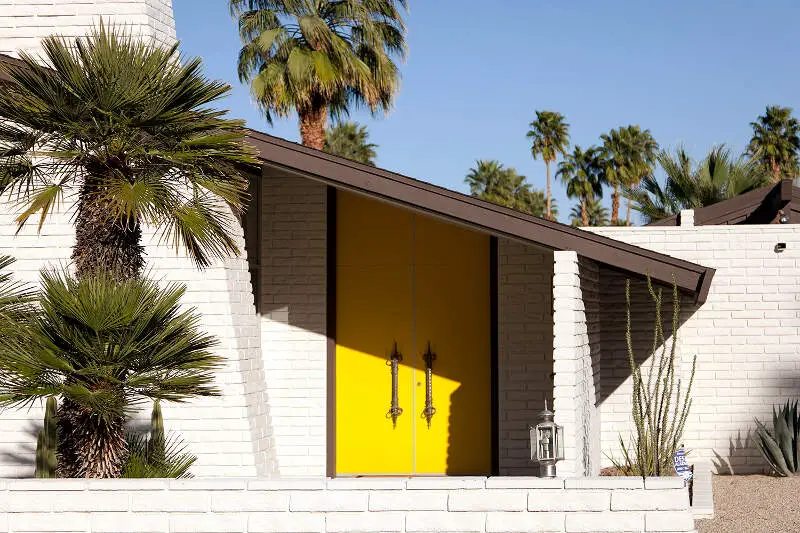
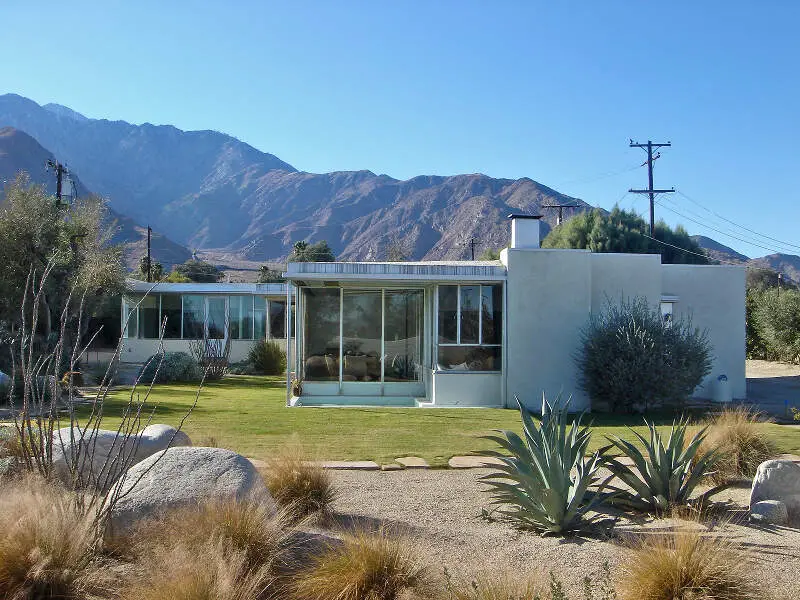
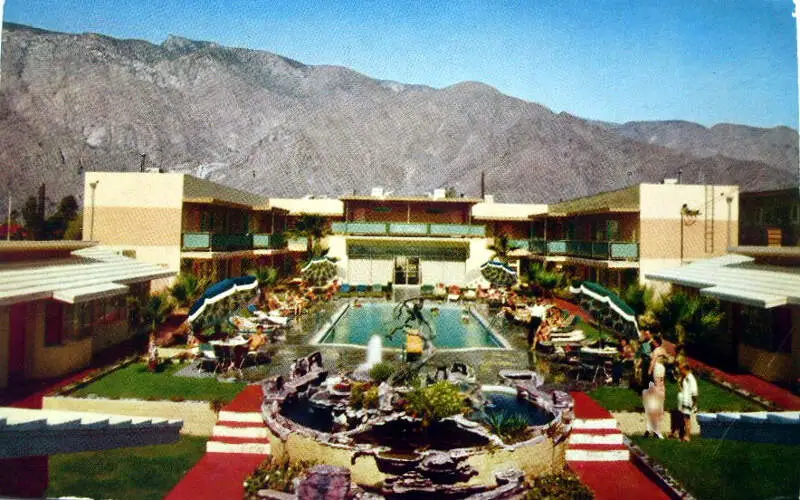
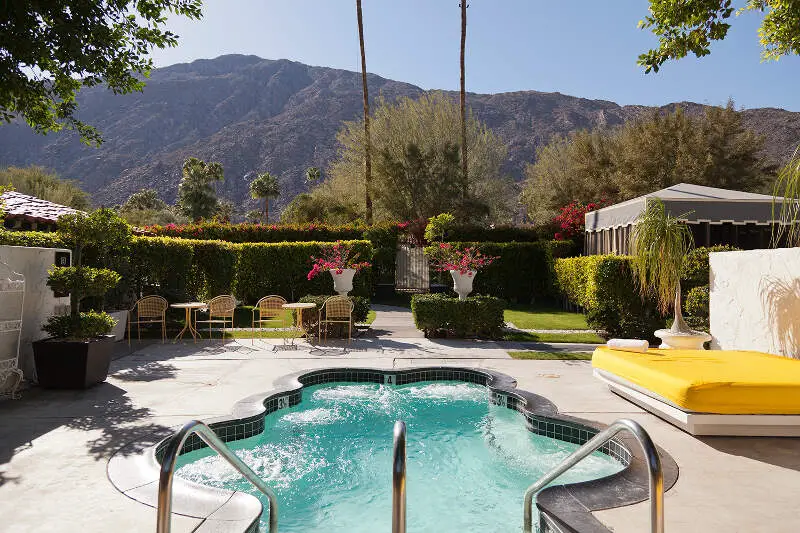
Palm Springs, CA Photos
1 Reviews & Comments About Palm Springs

I came to Palm Springs for a visit and decided to stay. The people are friendly and warm and welcoming. It truly felt like home from the beginning.
Palm Springs has long been known as a vacation destination to Hollywood stars, Marilyn Monroe was said to be discovered at the legendary Racquet Club. Palm Springs boasts many tourist attractions: the Tramway, Art museum, Living Desert and many antique boutiques. Palm Springs while extremely LGBT friendly is also very family friendly. Whatever you want from a tourist destination you can find here. A short commute to Los Angeles and the beaches of the Pacific coast and the ski resorts of the local mountains, Palm Springs is truly a gem and worth the visit.
Rankings & Articles For Palm Springs


Locations Around Palm Springs
Map Of Palm Springs, CA
Best Places Around Palm Springs
Desert Palms, CA
Population 6,579
Palm Desert, CA
Population 51,990
La Quinta, CA
Population 38,707
Rancho Mirage, CA
Population 17,563
Bermuda Dunes, CA
Population 7,971
Thousand Palms, CA
Population 7,720
Indian Wells, CA
Population 4,871
Indio, CA
Population 91,950
Desert Hot Springs, CA
Population 33,200
Palm Springs Demographics And Statistics
Population over time in Palm Springs
The current population in Palm Springs is 45,070. The population has increased 0.1% from 2010.
| Year | Population | % Change |
|---|---|---|
| 2024 | 45,070 | 0.2% |
| 2023 | 44,998 | 0.1% |
| 2022 | 44,935 | 0.3% |
| 2021 | 44,799 | -7.4% |
| 2020 | 48,390 | 1.0% |
| 2019 | 47,897 | 0.8% |
| 2018 | 47,525 | 0.8% |
| 2017 | 47,140 | 0.9% |
| 2016 | 46,714 | 0.9% |
| 2015 | 46,305 | 1.0% |
| 2014 | 45,827 | 1.1% |
| 2013 | 45,317 | 0.4% |
| 2012 | 45,115 | 0.2% |
| 2011 | 45,045 | 0.1% |
| 2010 | 45,012 | - |
Race / Ethnicity in Palm Springs
See the full breakdown
Palm Springs is:
61.4% White with 27,671 White residents.
4.3% African American with 1,948 African American residents.
0.4% American Indian with 160 American Indian residents.
5.3% Asian with 2,377 Asian residents.
0.2% Hawaiian with 98 Hawaiian residents.
0.3% Other with 134 Other residents.
2.4% Two Or More with 1,092 Two Or More residents.
25.7% Hispanic with 11,590 Hispanic residents.
| Race | Palm Springs | CA | USA |
|---|---|---|---|
| White | 61.4% | 33.8% | 57.4% |
| African American | 4.3% | 5.2% | 11.9% |
| American Indian | 0.4% | 0.3% | 0.5% |
| Asian | 5.3% | 15.3% | 5.9% |
| Hawaiian | 0.2% | 0.3% | 0.2% |
| Other | 0.3% | 0.6% | 0.6% |
| Two Or More | 2.4% | 4.4% | 4.3% |
| Hispanic | 25.7% | 40.2% | 19.3% |
Gender in Palm Springs
See the full breakdown
Palm Springs is 38.6% female with 17,384 female residents.
Palm Springs is 61.4% male with 27,685 male residents.
| Gender | Palm Springs | CA | USA |
|---|---|---|---|
| Female | 38.6% | 50.1% | 50.5% |
| Male | 61.4% | 49.9% | 49.5% |
Highest level of educational attainment in Palm Springs for adults over 25
See the full breakdown
2.0% of adults in Palm Springs completed < 9th grade.
5.0% of adults in Palm Springs completed 9-12th grade.
17.0% of adults in Palm Springs completed high school / ged.
23.0% of adults in Palm Springs completed some college.
8.0% of adults in Palm Springs completed associate's degree.
25.0% of adults in Palm Springs completed bachelor's degree.
13.0% of adults in Palm Springs completed master's degree.
5.0% of adults in Palm Springs completed professional degree.
2.0% of adults in Palm Springs completed doctorate degree.
| Education | Palm Springs | CA | USA |
|---|---|---|---|
| < 9th Grade | 2.0% | 8.0% | 4.0% |
| 9-12th Grade | 5.0% | 7.0% | 6.0% |
| High School / GED | 17.0% | 20.0% | 26.0% |
| Some College | 23.0% | 19.0% | 19.0% |
| Associate's Degree | 8.0% | 8.0% | 9.0% |
| Bachelor's Degree | 25.0% | 23.0% | 22.0% |
| Master's Degree | 13.0% | 10.0% | 10.0% |
| Professional Degree | 5.0% | 3.0% | 2.0% |
| Doctorate Degree | 2.0% | 2.0% | 2.0% |
Household Income For Palm Springs, California
See the full breakdown
6.5% of households in Palm Springs earn Less than $10,000.
2.7% of households in Palm Springs earn $10,000 to $14,999.
8.4% of households in Palm Springs earn $15,000 to $24,999.
9.1% of households in Palm Springs earn $25,000 to $34,999.
9.6% of households in Palm Springs earn $35,000 to $49,999.
14.7% of households in Palm Springs earn $50,000 to $74,999.
10.7% of households in Palm Springs earn $75,000 to $99,999.
14.1% of households in Palm Springs earn $100,000 to $149,999.
9.0% of households in Palm Springs earn $150,000 to $199,999.
15.2% of households in Palm Springs earn $200,000 or more.
| Income | Palm Springs | CA | USA |
|---|---|---|---|
| Less than $10,000 | 6.5% | 4.5% | 5.0% |
| $10,000 to $14,999 | 2.7% | 2.9% | 3.4% |
| $15,000 to $24,999 | 8.4% | 5.0% | 6.3% |
| $25,000 to $34,999 | 9.1% | 5.3% | 6.6% |
| $35,000 to $49,999 | 9.6% | 8.1% | 10.1% |
| $50,000 to $74,999 | 14.7% | 13.0% | 15.5% |
| $75,000 to $99,999 | 10.7% | 11.6% | 12.6% |
| $100,000 to $149,999 | 14.1% | 17.8% | 17.5% |
| $150,000 to $199,999 | 9.0% | 11.3% | 9.6% |
| $200,000 or more | 15.2% | 20.5% | 13.4% |
Source: U.S. Census ACS 5-year estimates (2024)


