Desert Hot Springs SnackAbility
Overall SnackAbility
Crime in Desert Hot Springs summary. We use data from the FBI to determine the crime rates in Desert Hot Springs. Key points include:
There were 571 total crimes in Desert Hot Springs in the last reporting year.
The overall crime rate per 100,000 people in Desert Hot Springs is 1,691.9 / 100k people.
The violent crime rate per 100,000 people in Desert Hot Springs is 491.9 / 100k people.
The property crime rate per 100,000 people in Desert Hot Springs is 1,200.0 / 100k people.
Overall, crime in Desert Hot Springs is -20.16% below the national average.
Total Crimes
Below National Average
Crime In Desert Hot Springs Comparison Table
| Statistic | Count Raw |
Desert Hot Springs / 100k People |
California / 100k People |
National / 100k People |
|---|---|---|---|---|
| Total Crimes Per 100K | 571 | 1,691.9 | 2,564.5 | 2,119.2 |
| Violent Crime | 166 | 491.9 | 486.0 | 359.0 |
| Murder | 3 | 8.9 | 4.5 | 5.0 |
| Robbery | 40 | 118.5 | 119.1 | 61.0 |
| Aggravated Assault | 113 | 334.8 | 325.8 | 256.0 |
| Property Crime | 405 | 1,200.0 | 2,078.4 | 1,760.0 |
| Burglary | 92 | 272.6 | 305.8 | 229.0 |
| Larceny | 186 | 551.1 | 1,345.2 | 1,272.0 |
| Car Theft | 127 | 376.3 | 427.5 | 259.0 |
Source: FBI Uniform Crime Reporting (2024)
Cost of living in Desert Hot Springs summary. We use data on the cost of living to determine how expensive it is to live in Desert Hot Springs. Real estate prices drive most of the variance in cost of living around California. Key points include:
The cost of living in Desert Hot Springs is 116 with 100 being average.
The cost of living in Desert Hot Springs is 1.2x higher than the national average.
The median home value in Desert Hot Springs is $377,729.
The median income in Desert Hot Springs is $52,761.
Desert Hot Springs's Overall Cost Of Living
Higher Than The National Average
Cost Of Living In Desert Hot Springs Comparison Table
| Living Expense | Desert Hot Springs | California | National Average |
|---|---|---|---|
| Overall | 116 | 142 | 100 |
| Services | 108 | 110 | 100 |
| Groceries | 113 | 118 | 100 |
| Health | 120 | 197 | 100 |
| Housing | 115 | 120 | 100 |
| Transportation | 113 | 121 | 100 |
| Utilities | 122 | 121 | 100 |
Source: Cost of living index, normalized to US average = 100
Desert Hot Springs, CA Weather
The average high in Desert Hot Springs is 81.2° and the average low is 52.0°.
There are 18.0 days of precipitation each year.
Expect an average of 10.0 inches of precipitation each year with 1.7 inches of snow.
| Stat | Desert Hot Springs |
|---|---|
| Average Annual High | 81.2 |
| Average Annual Low | 52.0 |
| Annual Precipitation Days | 18.0 |
| Average Annual Precipitation | 10.0 |
| Average Annual Snowfall | 1.7 |
Average High
Days of Rain
Source: NOAA climate normals (30-year)
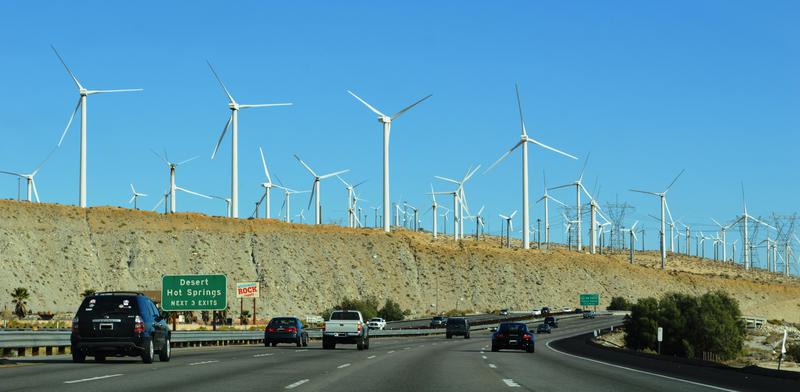
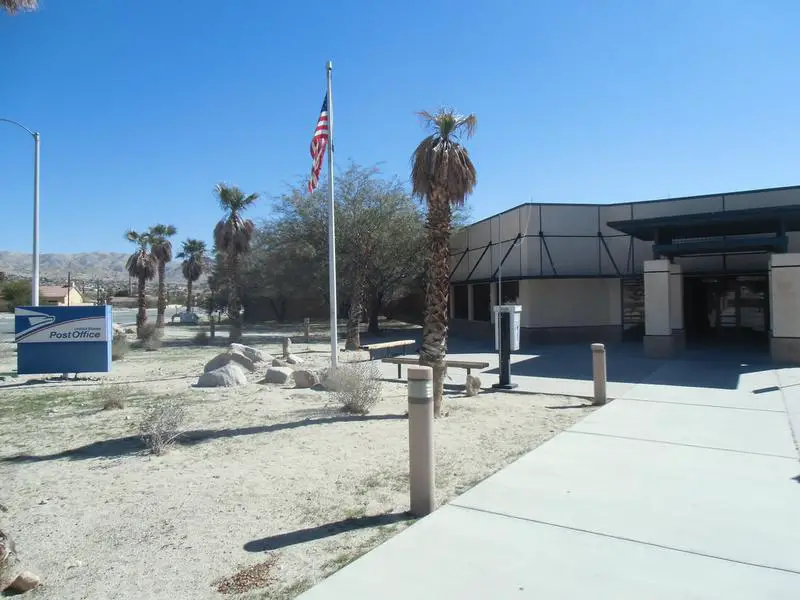
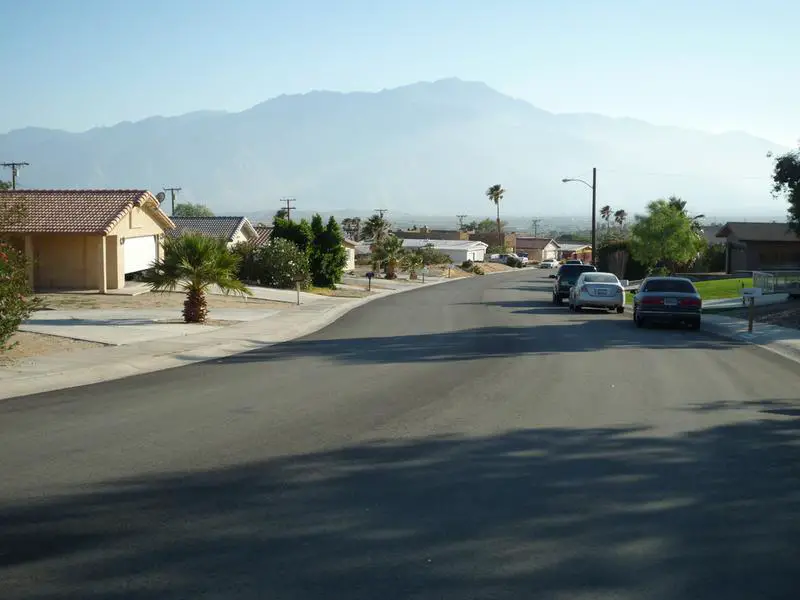
Desert Hot Springs, CA Photos
5 Reviews & Comments About Desert Hot Springs

I live in DHS and have most of my life there are bad parts but a lot of good in the city.. we have the best water on earth.. we were the first city to pass a marijuana bill to build factories and produce mass amounts or marijuana. I personally worked at the most exclusive spot in town where I met so many different celebrities athletes producers and so on.. and where the original watsu massage was created. that place is amazing, I met Robert plant many times.. if you listen to the immigrant song by led zeppelin, he says he goes were the hot springs flow.. man that was awesome to hear him say that. I agree that this place is not perfect but this place is getting a h**l of a lot better.. and if you like to smoke weed we have like 10 shops in this little town..
wow I live in desert hot springs and I moved out of Compton to move to this p***********t city but I'm working idk about all these other b*m a*s n****s asking for change
I live in Dhs, desert hot springs, I do have a friendly pit bull, we too have several weed shops, but we are safe, I would am not afraid to wonder around at night
I live in desert hot springs and it's not that bad
I live 2 miles from Desert Hot Springs in the Unincorporated area. Where I live there is no crime or burglaries. I can leave things outside and they are never touched. Desert Hot Springs doesn't have very many noticeable homeless people because the majority of Homeless live in Palm Springs. I go to the stores in Desert Hot Springs and I seldom ever see a homeless person. The crime in Palm Springs is much worse then Desert Hot Springs as a fact. Your opinion of Desert Hot Springs is wrong. Where are all of these abandoned homes you falsely state- If there are empty homes then they should be for sale. I buy and rent or sell homes I buy and I can tell you that there are few foreclosed homes for sale that are a bargain in Desert Hot Springs. Most residents travel to other places to do things since it takes 15 minutes to get most places. I love living in Desert Hot Springs.
Rankings & Articles For Desert Hot Springs


Locations Around Desert Hot Springs
Map Of Desert Hot Springs, CA
Best Places Around Desert Hot Springs
Desert Palms, CA
Population 6,579
Palm Desert, CA
Population 51,990
Rancho Mirage, CA
Population 17,563
Thousand Palms, CA
Population 7,720
Yucca Valley, CA
Population 21,770
Palm Springs, CA
Population 45,070
Joshua Tree, CA
Population 6,234
Desert Hot Springs Demographics And Statistics
Population over time in Desert Hot Springs
The current population in Desert Hot Springs is 33,200. The population has increased 34.5% from 2010.
| Year | Population | % Change |
|---|---|---|
| 2024 | 33,200 | 1.3% |
| 2023 | 32,786 | 1.2% |
| 2022 | 32,386 | 1.2% |
| 2021 | 31,988 | 9.2% |
| 2020 | 29,280 | 2.4% |
| 2019 | 28,585 | 0.5% |
| 2018 | 28,430 | 0.5% |
| 2017 | 28,298 | 0.7% |
| 2016 | 28,092 | 0.6% |
| 2015 | 27,912 | 0.8% |
| 2014 | 27,678 | 2.1% |
| 2013 | 27,096 | 2.3% |
| 2012 | 26,474 | 2.6% |
| 2011 | 25,793 | 4.5% |
| 2010 | 24,675 | - |
Race / Ethnicity in Desert Hot Springs
See the full breakdown
Desert Hot Springs is:
21.3% White with 7,066 White residents.
8.9% African American with 2,963 African American residents.
0.3% American Indian with 110 American Indian residents.
1.4% Asian with 463 Asian residents.
0.6% Hawaiian with 213 Hawaiian residents.
0.5% Other with 168 Other residents.
3.3% Two Or More with 1,107 Two Or More residents.
63.6% Hispanic with 21,110 Hispanic residents.
| Race | Desert Hot Springs | CA | USA |
|---|---|---|---|
| White | 21.3% | 33.8% | 57.4% |
| African American | 8.9% | 5.2% | 11.9% |
| American Indian | 0.3% | 0.3% | 0.5% |
| Asian | 1.4% | 15.3% | 5.9% |
| Hawaiian | 0.6% | 0.3% | 0.2% |
| Other | 0.5% | 0.6% | 0.6% |
| Two Or More | 3.3% | 4.4% | 4.3% |
| Hispanic | 63.6% | 40.2% | 19.3% |
Gender in Desert Hot Springs
See the full breakdown
Desert Hot Springs is 51.0% female with 16,939 female residents.
Desert Hot Springs is 49.0% male with 16,261 male residents.
| Gender | Desert Hot Springs | CA | USA |
|---|---|---|---|
| Female | 51.0% | 50.1% | 50.5% |
| Male | 49.0% | 49.9% | 49.5% |
Highest level of educational attainment in Desert Hot Springs for adults over 25
See the full breakdown
11.0% of adults in Desert Hot Springs completed < 9th grade.
9.0% of adults in Desert Hot Springs completed 9-12th grade.
34.0% of adults in Desert Hot Springs completed high school / ged.
22.0% of adults in Desert Hot Springs completed some college.
7.0% of adults in Desert Hot Springs completed associate's degree.
11.0% of adults in Desert Hot Springs completed bachelor's degree.
3.0% of adults in Desert Hot Springs completed master's degree.
2.0% of adults in Desert Hot Springs completed professional degree.
1.0% of adults in Desert Hot Springs completed doctorate degree.
| Education | Desert Hot Springs | CA | USA |
|---|---|---|---|
| < 9th Grade | 11.0% | 8.0% | 4.0% |
| 9-12th Grade | 9.0% | 7.0% | 6.0% |
| High School / GED | 34.0% | 20.0% | 26.0% |
| Some College | 22.0% | 19.0% | 19.0% |
| Associate's Degree | 7.0% | 8.0% | 9.0% |
| Bachelor's Degree | 11.0% | 23.0% | 22.0% |
| Master's Degree | 3.0% | 10.0% | 10.0% |
| Professional Degree | 2.0% | 3.0% | 2.0% |
| Doctorate Degree | 1.0% | 2.0% | 2.0% |
Household Income For Desert Hot Springs, California
See the full breakdown
7.0% of households in Desert Hot Springs earn Less than $10,000.
4.1% of households in Desert Hot Springs earn $10,000 to $14,999.
11.3% of households in Desert Hot Springs earn $15,000 to $24,999.
11.8% of households in Desert Hot Springs earn $25,000 to $34,999.
12.2% of households in Desert Hot Springs earn $35,000 to $49,999.
17.8% of households in Desert Hot Springs earn $50,000 to $74,999.
12.2% of households in Desert Hot Springs earn $75,000 to $99,999.
15.3% of households in Desert Hot Springs earn $100,000 to $149,999.
6.3% of households in Desert Hot Springs earn $150,000 to $199,999.
2.0% of households in Desert Hot Springs earn $200,000 or more.
| Income | Desert Hot Springs | CA | USA |
|---|---|---|---|
| Less than $10,000 | 7.0% | 4.5% | 5.0% |
| $10,000 to $14,999 | 4.1% | 2.9% | 3.4% |
| $15,000 to $24,999 | 11.3% | 5.0% | 6.3% |
| $25,000 to $34,999 | 11.8% | 5.3% | 6.6% |
| $35,000 to $49,999 | 12.2% | 8.1% | 10.1% |
| $50,000 to $74,999 | 17.8% | 13.0% | 15.5% |
| $75,000 to $99,999 | 12.2% | 11.6% | 12.6% |
| $100,000 to $149,999 | 15.3% | 17.8% | 17.5% |
| $150,000 to $199,999 | 6.3% | 11.3% | 9.6% |
| $200,000 or more | 2.0% | 20.5% | 13.4% |
Source: U.S. Census ACS 5-year estimates (2024)


