San Clemente SnackAbility
Overall SnackAbility
Crime in San Clemente summary. We use data from the FBI to determine the crime rates in San Clemente. Key points include:
There were 895 total crimes in San Clemente in the last reporting year.
The overall crime rate per 100,000 people in San Clemente is 1,450.8 / 100k people.
The violent crime rate per 100,000 people in San Clemente is 183.2 / 100k people.
The property crime rate per 100,000 people in San Clemente is 1,267.6 / 100k people.
Overall, crime in San Clemente is -31.54% below the national average.
Total Crimes
Below National Average
Crime In San Clemente Comparison Table
| Statistic | Count Raw |
San Clemente / 100k People |
California / 100k People |
National / 100k People |
|---|---|---|---|---|
| Total Crimes Per 100K | 895 | 1,450.8 | 2,564.5 | 2,119.2 |
| Violent Crime | 113 | 183.2 | 486.0 | 359.0 |
| Murder | 1 | 1.6 | 4.5 | 5.0 |
| Robbery | 26 | 42.1 | 119.1 | 61.0 |
| Aggravated Assault | 82 | 132.9 | 325.8 | 256.0 |
| Property Crime | 782 | 1,267.6 | 2,078.4 | 1,760.0 |
| Burglary | 84 | 136.2 | 305.8 | 229.0 |
| Larceny | 571 | 925.6 | 1,345.2 | 1,272.0 |
| Car Theft | 127 | 205.9 | 427.5 | 259.0 |
Source: FBI Uniform Crime Reporting (2024)
Cost of living in San Clemente summary. We use data on the cost of living to determine how expensive it is to live in San Clemente. Real estate prices drive most of the variance in cost of living around California. Key points include:
The cost of living in San Clemente is 206 with 100 being average.
The cost of living in San Clemente is 2.1x higher than the national average.
The median home value in San Clemente is $1,721,005.
The median income in San Clemente is $140,062.
San Clemente's Overall Cost Of Living
Higher Than The National Average
Cost Of Living In San Clemente Comparison Table
| Living Expense | San Clemente | California | National Average |
|---|---|---|---|
| Overall | 206 | 142 | 100 |
| Services | 110 | 110 | 100 |
| Groceries | 114 | 118 | 100 |
| Health | 419 | 197 | 100 |
| Housing | 123 | 120 | 100 |
| Transportation | 121 | 121 | 100 |
| Utilities | 119 | 121 | 100 |
Source: Cost of living index, normalized to US average = 100
San Clemente, CA Weather
The average high in San Clemente is 74.4° and the average low is 54.4°.
There are 22.9 days of precipitation each year.
Expect an average of 13.3 inches of precipitation each year with 0.0 inches of snow.
| Stat | San Clemente |
|---|---|
| Average Annual High | 74.4 |
| Average Annual Low | 54.4 |
| Annual Precipitation Days | 22.9 |
| Average Annual Precipitation | 13.3 |
| Average Annual Snowfall | 0.0 |
Average High
Days of Rain
Source: NOAA climate normals (30-year)
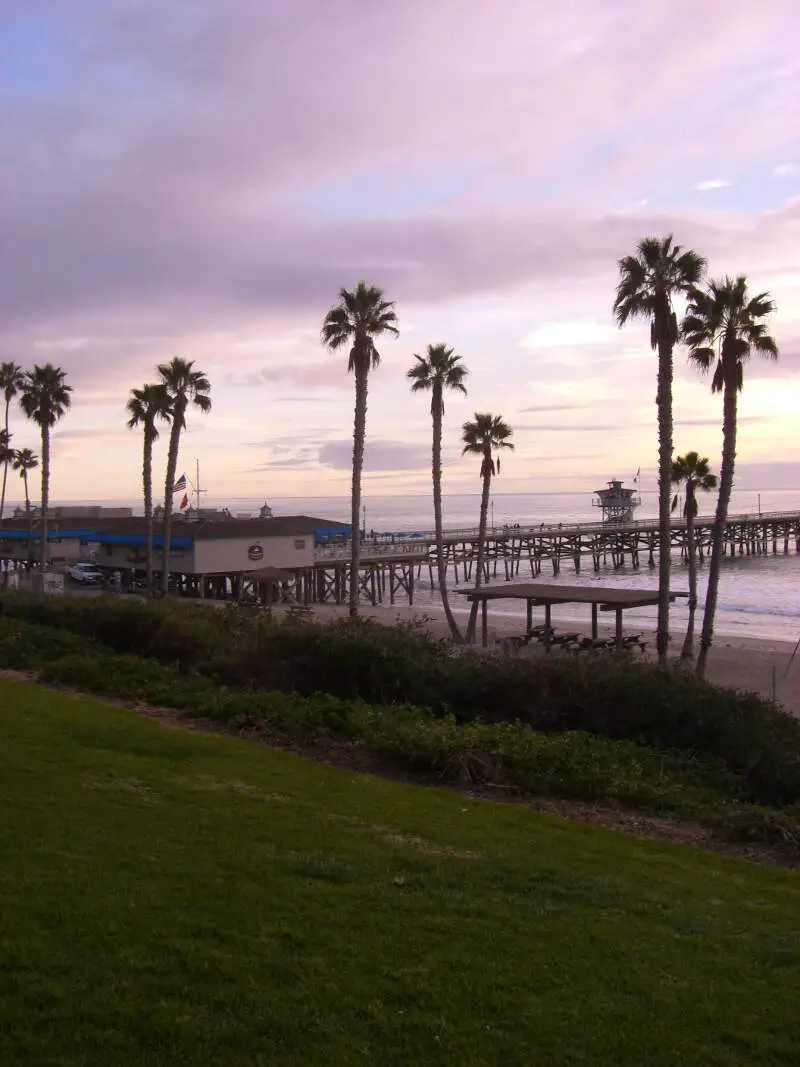
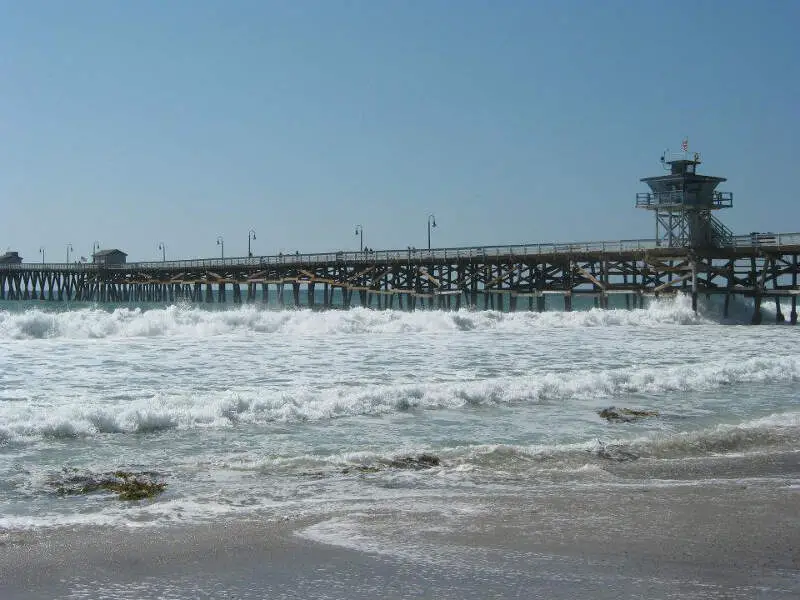
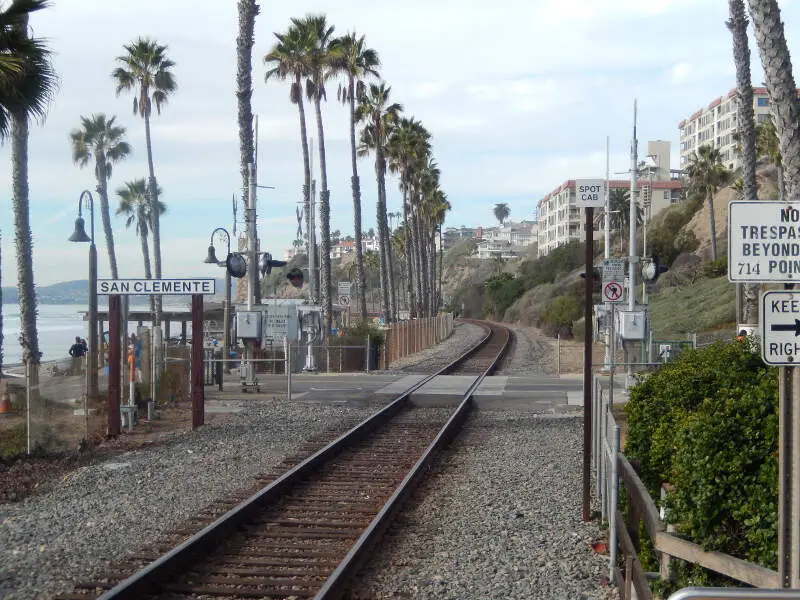
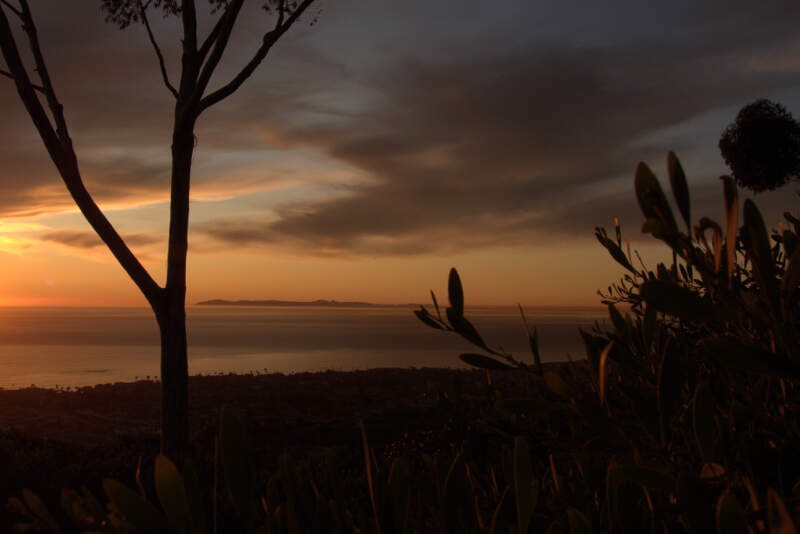
San Clemente, CA Photos

Rankings & Articles For San Clemente


Locations Around San Clemente
Map Of San Clemente, CA
Best Places Around San Clemente
Mission Viejo, CA
Population 92,151
Aliso Viejo, CA
Population 51,113
Rancho Santa Margarita, CA
Population 46,990
Lake Forest, CA
Population 86,281
Laguna Hills, CA
Population 30,740
Ladera Ranch, CA
Population 23,793
Irvine, CA
Population 311,690
Coto de Caza, CA
Population 15,190
Laguna Niguel, CA
Population 64,139
San Juan Capistrano, CA
Population 35,095
San Clemente Demographics And Statistics
Population over time in San Clemente
The current population in San Clemente is 63,273. The population has increased 4.1% from 2010.
| Year | Population | % Change |
|---|---|---|
| 2024 | 63,273 | -0.4% |
| 2023 | 63,510 | -1.1% |
| 2022 | 64,232 | -0.6% |
| 2021 | 64,600 | -0.5% |
| 2020 | 64,929 | 0.1% |
| 2019 | 64,878 | -0.3% |
| 2018 | 65,045 | -0.3% |
| 2017 | 65,226 | 0.2% |
| 2016 | 65,082 | 0.1% |
| 2015 | 65,017 | 0.5% |
| 2014 | 64,673 | 1.1% |
| 2013 | 63,994 | 1.3% |
| 2012 | 63,187 | 1.8% |
| 2011 | 62,052 | 2.1% |
| 2010 | 60,774 | - |
Race / Ethnicity in San Clemente
See the full breakdown
San Clemente is:
71.6% White with 45,317 White residents.
0.9% African American with 571 African American residents.
0.1% American Indian with 66 American Indian residents.
4.4% Asian with 2,757 Asian residents.
0.2% Hawaiian with 117 Hawaiian residents.
0.2% Other with 153 Other residents.
5.6% Two Or More with 3,531 Two Or More residents.
17.0% Hispanic with 10,761 Hispanic residents.
| Race | San Clemente | CA | USA |
|---|---|---|---|
| White | 71.6% | 33.8% | 57.4% |
| African American | 0.9% | 5.2% | 11.9% |
| American Indian | 0.1% | 0.3% | 0.5% |
| Asian | 4.4% | 15.3% | 5.9% |
| Hawaiian | 0.2% | 0.3% | 0.2% |
| Other | 0.2% | 0.6% | 0.6% |
| Two Or More | 5.6% | 4.4% | 4.3% |
| Hispanic | 17.0% | 40.2% | 19.3% |
Gender in San Clemente
See the full breakdown
San Clemente is 48.4% female with 30,601 female residents.
San Clemente is 51.6% male with 32,671 male residents.
| Gender | San Clemente | CA | USA |
|---|---|---|---|
| Female | 48.4% | 50.1% | 50.5% |
| Male | 51.6% | 49.9% | 49.5% |
Highest level of educational attainment in San Clemente for adults over 25
See the full breakdown
5.0% of adults in San Clemente completed < 9th grade.
2.0% of adults in San Clemente completed 9-12th grade.
13.0% of adults in San Clemente completed high school / ged.
19.0% of adults in San Clemente completed some college.
8.0% of adults in San Clemente completed associate's degree.
33.0% of adults in San Clemente completed bachelor's degree.
14.0% of adults in San Clemente completed master's degree.
4.0% of adults in San Clemente completed professional degree.
2.0% of adults in San Clemente completed doctorate degree.
| Education | San Clemente | CA | USA |
|---|---|---|---|
| < 9th Grade | 5.0% | 8.0% | 4.0% |
| 9-12th Grade | 2.0% | 7.0% | 6.0% |
| High School / GED | 13.0% | 20.0% | 26.0% |
| Some College | 19.0% | 19.0% | 19.0% |
| Associate's Degree | 8.0% | 8.0% | 9.0% |
| Bachelor's Degree | 33.0% | 23.0% | 22.0% |
| Master's Degree | 14.0% | 10.0% | 10.0% |
| Professional Degree | 4.0% | 3.0% | 2.0% |
| Doctorate Degree | 2.0% | 2.0% | 2.0% |
Household Income For San Clemente, California
See the full breakdown
3.7% of households in San Clemente earn Less than $10,000.
1.5% of households in San Clemente earn $10,000 to $14,999.
3.1% of households in San Clemente earn $15,000 to $24,999.
3.5% of households in San Clemente earn $25,000 to $34,999.
5.6% of households in San Clemente earn $35,000 to $49,999.
9.0% of households in San Clemente earn $50,000 to $74,999.
10.5% of households in San Clemente earn $75,000 to $99,999.
15.8% of households in San Clemente earn $100,000 to $149,999.
11.6% of households in San Clemente earn $150,000 to $199,999.
35.8% of households in San Clemente earn $200,000 or more.
| Income | San Clemente | CA | USA |
|---|---|---|---|
| Less than $10,000 | 3.7% | 4.5% | 5.0% |
| $10,000 to $14,999 | 1.5% | 2.9% | 3.4% |
| $15,000 to $24,999 | 3.1% | 5.0% | 6.3% |
| $25,000 to $34,999 | 3.5% | 5.3% | 6.6% |
| $35,000 to $49,999 | 5.6% | 8.1% | 10.1% |
| $50,000 to $74,999 | 9.0% | 13.0% | 15.5% |
| $75,000 to $99,999 | 10.5% | 11.6% | 12.6% |
| $100,000 to $149,999 | 15.8% | 17.8% | 17.5% |
| $150,000 to $199,999 | 11.6% | 11.3% | 9.6% |
| $200,000 or more | 35.8% | 20.5% | 13.4% |
Source: U.S. Census ACS 5-year estimates (2024)


