Santa Clarita SnackAbility
Overall SnackAbility
Crime in Santa Clarita summary. We use data from the FBI to determine the crime rates in Santa Clarita. Key points include:
There were 2,970 total crimes in Santa Clarita in the last reporting year.
The overall crime rate per 100,000 people in Santa Clarita is 1,342.1 / 100k people.
The violent crime rate per 100,000 people in Santa Clarita is 165.4 / 100k people.
The property crime rate per 100,000 people in Santa Clarita is 1,176.7 / 100k people.
Overall, crime in Santa Clarita is -36.67% below the national average.
Total Crimes
Below National Average
Crime In Santa Clarita Comparison Table
| Statistic | Count Raw |
Santa Clarita / 100k People |
California / 100k People |
National / 100k People |
|---|---|---|---|---|
| Total Crimes Per 100K | 2,970 | 1,342.1 | 2,564.5 | 2,119.2 |
| Violent Crime | 366 | 165.4 | 486.0 | 359.0 |
| Murder | 2 | 0.9 | 4.5 | 5.0 |
| Robbery | 94 | 42.5 | 119.1 | 61.0 |
| Aggravated Assault | 242 | 109.4 | 325.8 | 256.0 |
| Property Crime | 2,604 | 1,176.7 | 2,078.4 | 1,760.0 |
| Burglary | 433 | 195.7 | 305.8 | 229.0 |
| Larceny | 1,731 | 782.2 | 1,345.2 | 1,272.0 |
| Car Theft | 440 | 198.8 | 427.5 | 259.0 |
Source: FBI Uniform Crime Reporting (2024)
Cost of living in Santa Clarita summary. We use data on the cost of living to determine how expensive it is to live in Santa Clarita. Real estate prices drive most of the variance in cost of living around California. Key points include:
The cost of living in Santa Clarita is 165 with 100 being average.
The cost of living in Santa Clarita is 1.6x higher than the national average.
The median home value in Santa Clarita is $802,016.
The median income in Santa Clarita is $123,062.
Santa Clarita's Overall Cost Of Living
Higher Than The National Average
Cost Of Living In Santa Clarita Comparison Table
| Living Expense | Santa Clarita | California | National Average |
|---|---|---|---|
| Overall | 165 | 142 | 100 |
| Services | 108 | 110 | 100 |
| Groceries | 121 | 118 | 100 |
| Health | 275 | 197 | 100 |
| Housing | 124 | 120 | 100 |
| Transportation | 117 | 121 | 100 |
| Utilities | 123 | 121 | 100 |
Source: Cost of living index, normalized to US average = 100
Santa Clarita, CA Weather
The average high in Santa Clarita is 75.3° and the average low is 54.1°.
There are 22.7 days of precipitation each year.
Expect an average of 16.2 inches of precipitation each year with 0.2 inches of snow.
| Stat | Santa Clarita |
|---|---|
| Average Annual High | 75.3 |
| Average Annual Low | 54.1 |
| Annual Precipitation Days | 22.7 |
| Average Annual Precipitation | 16.2 |
| Average Annual Snowfall | 0.2 |
Average High
Days of Rain
Source: NOAA climate normals (30-year)
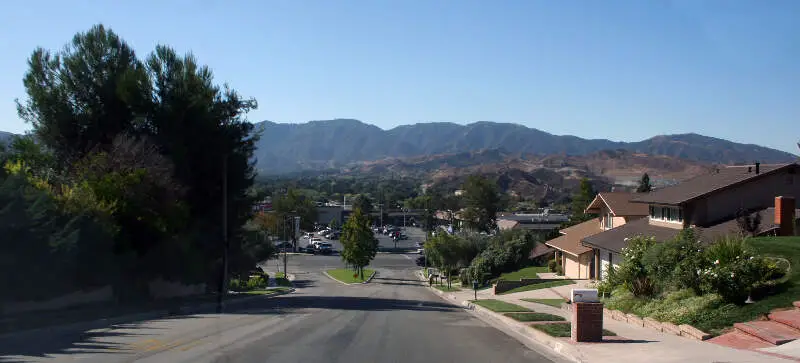
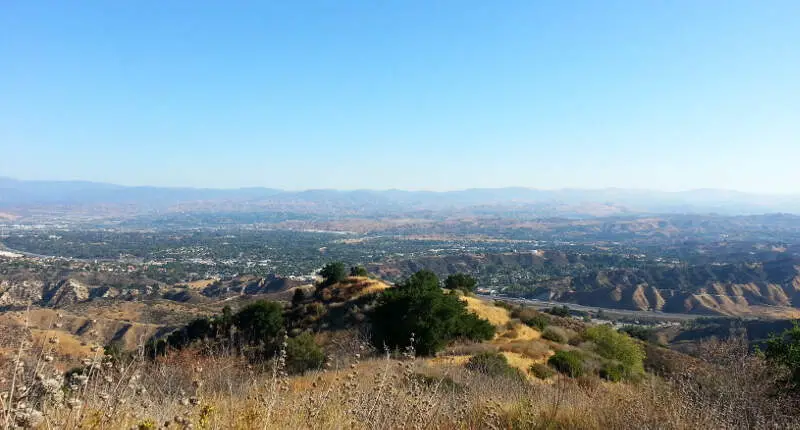
Santa Clarita, CA Photos
1 Reviews & Comments About Santa Clarita

Overall, Santa Clarita from a younger individual's perspective is very bland. The city simply lacks of things to do.
What stood out the most about Santa Clarita is how I felt secured in this city. Also the family appears to be more about raising a family.
Rankings & Articles For Santa Clarita


Locations Around Santa Clarita
Map Of Santa Clarita, CA
Best Places Around Santa Clarita
San Fernando, CA
Population 23,632
La Crescenta-Montrose, CA
Population 19,660
Castaic, CA
Population 17,999
Simi Valley, CA
Population 125,634
Burbank, CA
Population 5,333
Stevenson Ranch, CA
Population 20,990
Acton, CA
Population 7,880
Santa Clarita Demographics And Statistics
Population over time in Santa Clarita
The current population in Santa Clarita is 230,221. The population has increased 33.7% from 2010.
| Year | Population | % Change |
|---|---|---|
| 2024 | 230,221 | 0.5% |
| 2023 | 229,021 | 1.4% |
| 2022 | 225,850 | -0.6% |
| 2021 | 227,182 | 6.9% |
| 2020 | 212,519 | -0.4% |
| 2019 | 213,411 | 1.9% |
| 2018 | 209,478 | -0.0% |
| 2017 | 209,489 | 16.2% |
| 2016 | 180,303 | 0.2% |
| 2015 | 179,950 | 0.5% |
| 2014 | 179,030 | 0.9% |
| 2013 | 177,366 | 0.8% |
| 2012 | 175,922 | 1.1% |
| 2011 | 173,993 | 1.0% |
| 2010 | 172,253 | - |
Race / Ethnicity in Santa Clarita
See the full breakdown
Santa Clarita is:
41.2% White with 94,913 White residents.
4.3% African American with 9,974 African American residents.
0.1% American Indian with 148 American Indian residents.
12.0% Asian with 27,662 Asian residents.
0.3% Hawaiian with 762 Hawaiian residents.
0.6% Other with 1,466 Other residents.
5.1% Two Or More with 11,648 Two Or More residents.
36.3% Hispanic with 83,648 Hispanic residents.
| Race | Santa Clarita | CA | USA |
|---|---|---|---|
| White | 41.2% | 33.8% | 57.4% |
| African American | 4.3% | 5.2% | 11.9% |
| American Indian | 0.1% | 0.3% | 0.5% |
| Asian | 12.0% | 15.3% | 5.9% |
| Hawaiian | 0.3% | 0.3% | 0.2% |
| Other | 0.6% | 0.6% | 0.6% |
| Two Or More | 5.1% | 4.4% | 4.3% |
| Hispanic | 36.3% | 40.2% | 19.3% |
Gender in Santa Clarita
See the full breakdown
Santa Clarita is 50.6% female with 116,538 female residents.
Santa Clarita is 49.4% male with 113,682 male residents.
| Gender | Santa Clarita | CA | USA |
|---|---|---|---|
| Female | 50.6% | 50.1% | 50.5% |
| Male | 49.4% | 49.9% | 49.5% |
Highest level of educational attainment in Santa Clarita for adults over 25
See the full breakdown
3.0% of adults in Santa Clarita completed < 9th grade.
5.0% of adults in Santa Clarita completed 9-12th grade.
19.0% of adults in Santa Clarita completed high school / ged.
22.0% of adults in Santa Clarita completed some college.
10.0% of adults in Santa Clarita completed associate's degree.
27.0% of adults in Santa Clarita completed bachelor's degree.
10.0% of adults in Santa Clarita completed master's degree.
2.0% of adults in Santa Clarita completed professional degree.
2.0% of adults in Santa Clarita completed doctorate degree.
| Education | Santa Clarita | CA | USA |
|---|---|---|---|
| < 9th Grade | 3.0% | 8.0% | 4.0% |
| 9-12th Grade | 5.0% | 7.0% | 6.0% |
| High School / GED | 19.0% | 20.0% | 26.0% |
| Some College | 22.0% | 19.0% | 19.0% |
| Associate's Degree | 10.0% | 8.0% | 9.0% |
| Bachelor's Degree | 27.0% | 23.0% | 22.0% |
| Master's Degree | 10.0% | 10.0% | 10.0% |
| Professional Degree | 2.0% | 3.0% | 2.0% |
| Doctorate Degree | 2.0% | 2.0% | 2.0% |
Household Income For Santa Clarita, California
See the full breakdown
2.8% of households in Santa Clarita earn Less than $10,000.
1.3% of households in Santa Clarita earn $10,000 to $14,999.
3.1% of households in Santa Clarita earn $15,000 to $24,999.
4.5% of households in Santa Clarita earn $25,000 to $34,999.
6.5% of households in Santa Clarita earn $35,000 to $49,999.
10.7% of households in Santa Clarita earn $50,000 to $74,999.
10.1% of households in Santa Clarita earn $75,000 to $99,999.
20.2% of households in Santa Clarita earn $100,000 to $149,999.
15.3% of households in Santa Clarita earn $150,000 to $199,999.
25.5% of households in Santa Clarita earn $200,000 or more.
| Income | Santa Clarita | CA | USA |
|---|---|---|---|
| Less than $10,000 | 2.8% | 4.5% | 5.0% |
| $10,000 to $14,999 | 1.3% | 2.9% | 3.4% |
| $15,000 to $24,999 | 3.1% | 5.0% | 6.3% |
| $25,000 to $34,999 | 4.5% | 5.3% | 6.6% |
| $35,000 to $49,999 | 6.5% | 8.1% | 10.1% |
| $50,000 to $74,999 | 10.7% | 13.0% | 15.5% |
| $75,000 to $99,999 | 10.1% | 11.6% | 12.6% |
| $100,000 to $149,999 | 20.2% | 17.8% | 17.5% |
| $150,000 to $199,999 | 15.3% | 11.3% | 9.6% |
| $200,000 or more | 25.5% | 20.5% | 13.4% |
Source: U.S. Census ACS 5-year estimates (2024)


