Simi Valley SnackAbility
Overall SnackAbility
Crime in Simi Valley summary. We use data from the FBI to determine the crime rates in Simi Valley. Key points include:
There were 1,313 total crimes in Simi Valley in the last reporting year.
The overall crime rate per 100,000 people in Simi Valley is 1,052.9 / 100k people.
The violent crime rate per 100,000 people in Simi Valley is 129.1 / 100k people.
The property crime rate per 100,000 people in Simi Valley is 923.8 / 100k people.
Overall, crime in Simi Valley is -50.32% below the national average.
Total Crimes
Below National Average
Crime In Simi Valley Comparison Table
| Statistic | Count Raw |
Simi Valley / 100k People |
California / 100k People |
National / 100k People |
|---|---|---|---|---|
| Total Crimes Per 100K | 1,313 | 1,052.9 | 2,564.5 | 2,119.2 |
| Violent Crime | 161 | 129.1 | 486.0 | 359.0 |
| Murder | 3 | 2.4 | 4.5 | 5.0 |
| Robbery | 31 | 24.9 | 119.1 | 61.0 |
| Aggravated Assault | 108 | 86.6 | 325.8 | 256.0 |
| Property Crime | 1,152 | 923.8 | 2,078.4 | 1,760.0 |
| Burglary | 155 | 124.3 | 305.8 | 229.0 |
| Larceny | 891 | 714.5 | 1,345.2 | 1,272.0 |
| Car Theft | 106 | 85.0 | 427.5 | 259.0 |
Source: FBI Uniform Crime Reporting (2024)
Cost of living in Simi Valley summary. We use data on the cost of living to determine how expensive it is to live in Simi Valley. Real estate prices drive most of the variance in cost of living around California. Key points include:
The cost of living in Simi Valley is 177 with 100 being average.
The cost of living in Simi Valley is 1.8x higher than the national average.
The median home value in Simi Valley is $844,909.
The median income in Simi Valley is $122,081.
Simi Valley's Overall Cost Of Living
Higher Than The National Average
Cost Of Living In Simi Valley Comparison Table
| Living Expense | Simi Valley | California | National Average |
|---|---|---|---|
| Overall | 177 | 142 | 100 |
| Services | 112 | 110 | 100 |
| Groceries | 117 | 118 | 100 |
| Health | 308 | 197 | 100 |
| Housing | 115 | 120 | 100 |
| Transportation | 127 | 121 | 100 |
| Utilities | 124 | 121 | 100 |
Source: Cost of living index, normalized to US average = 100
Simi Valley, CA Weather
The average high in Simi Valley is 72.0° and the average low is 51.7°.
There are 24.0 days of precipitation each year.
Expect an average of 17.2 inches of precipitation each year with 0.0 inches of snow.
| Stat | Simi Valley |
|---|---|
| Average Annual High | 72.0 |
| Average Annual Low | 51.7 |
| Annual Precipitation Days | 24.0 |
| Average Annual Precipitation | 17.2 |
| Average Annual Snowfall | 0.0 |
Average High
Days of Rain
Source: NOAA climate normals (30-year)
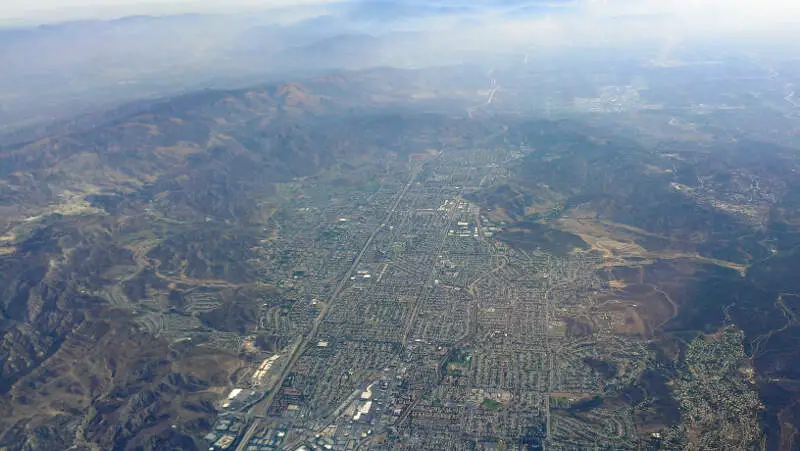
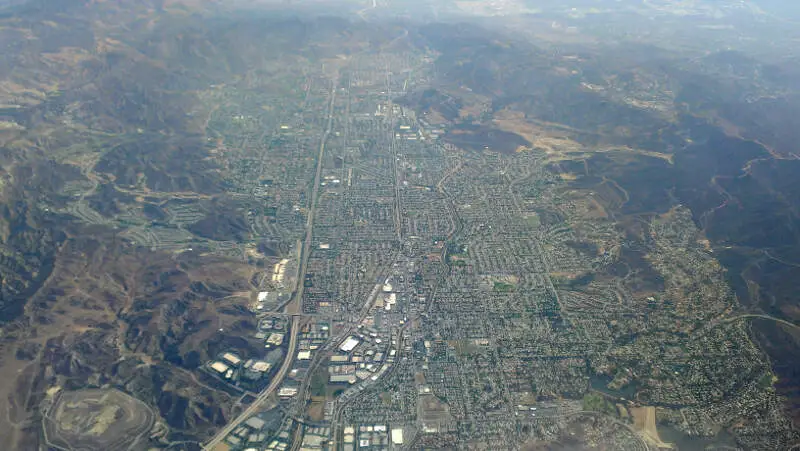
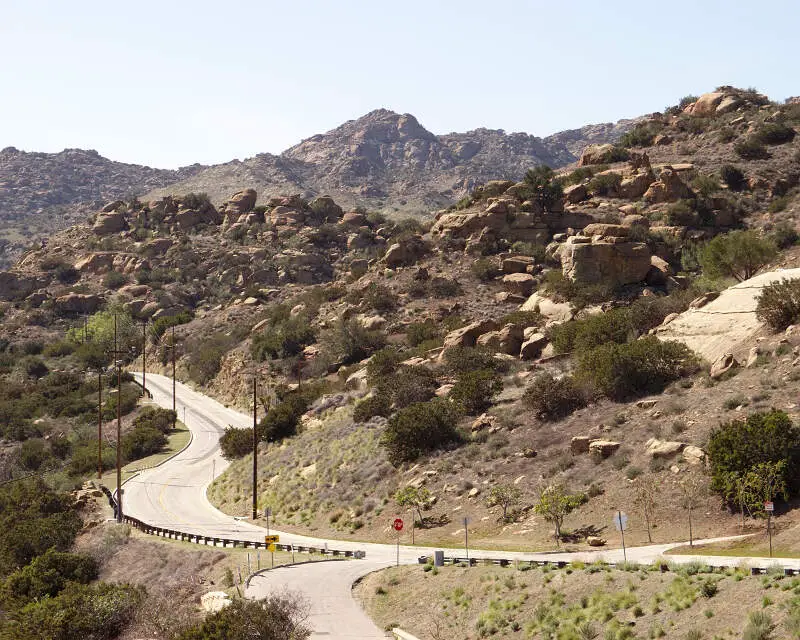
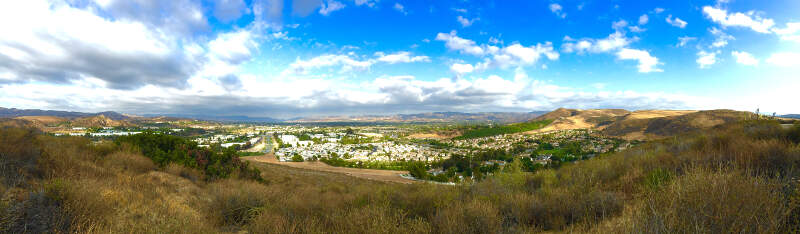
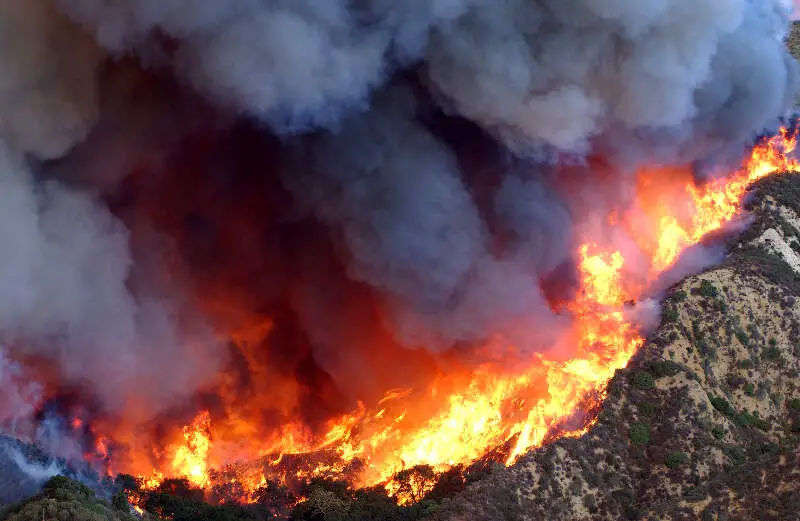
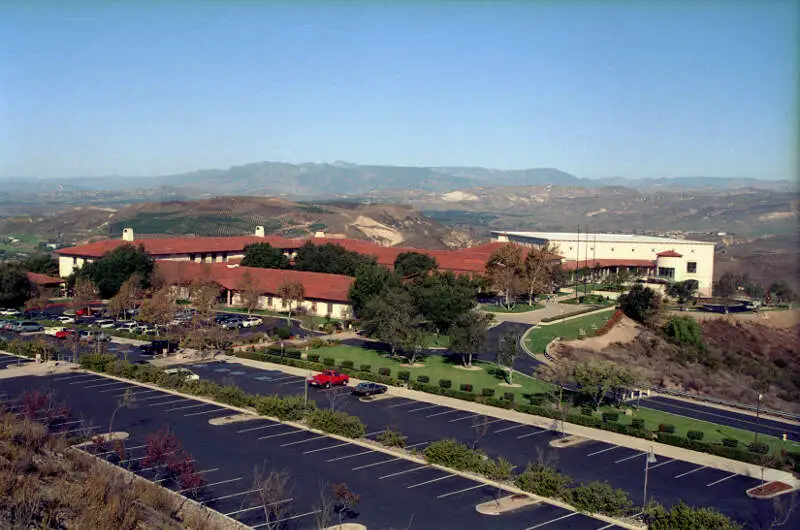
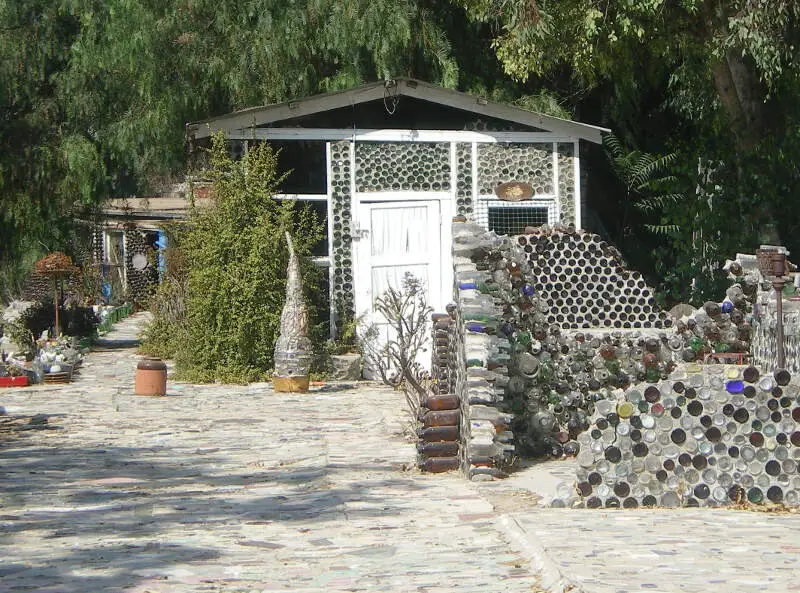
Simi Valley, CA Photos


Rankings & Articles For Simi Valley


Locations Around Simi Valley
Map Of Simi Valley, CA
Best Places Around Simi Valley
Camarillo, CA
Population 70,186
Agoura Hills, CA
Population 19,721
Moorpark, CA
Population 35,854
Oak Park, CA
Population 13,757
San Fernando, CA
Population 23,632
Santa Clarita, CA
Population 230,221
Castaic, CA
Population 17,999
Thousand Oaks, CA
Population 125,205
Stevenson Ranch, CA
Population 20,990
Calabasas, CA
Population 22,669
Simi Valley Demographics And Statistics
Population over time in Simi Valley
The current population in Simi Valley is 125,634. The population has increased 3.3% from 2010.
| Year | Population | % Change |
|---|---|---|
| 2024 | 125,634 | -0.1% |
| 2023 | 125,769 | -0.3% |
| 2022 | 126,153 | -0.5% |
| 2021 | 126,809 | 0.8% |
| 2020 | 125,768 | -0.1% |
| 2019 | 125,842 | -0.3% |
| 2018 | 126,199 | -0.3% |
| 2017 | 126,546 | 0.3% |
| 2016 | 126,126 | 0.0% |
| 2015 | 126,103 | 0.3% |
| 2014 | 125,699 | 0.7% |
| 2013 | 124,803 | 0.7% |
| 2012 | 123,942 | 0.9% |
| 2011 | 122,864 | 1.0% |
| 2010 | 121,662 | - |
Race / Ethnicity in Simi Valley
See the full breakdown
Simi Valley is:
53.3% White with 66,988 White residents.
1.2% African American with 1,556 African American residents.
0.1% American Indian with 164 American Indian residents.
10.3% Asian with 12,888 Asian residents.
0.2% Hawaiian with 191 Hawaiian residents.
0.7% Other with 817 Other residents.
5.2% Two Or More with 6,592 Two Or More residents.
29.0% Hispanic with 36,438 Hispanic residents.
| Race | Simi Valley | CA | USA |
|---|---|---|---|
| White | 53.3% | 33.8% | 57.4% |
| African American | 1.2% | 5.2% | 11.9% |
| American Indian | 0.1% | 0.3% | 0.5% |
| Asian | 10.3% | 15.3% | 5.9% |
| Hawaiian | 0.2% | 0.3% | 0.2% |
| Other | 0.7% | 0.6% | 0.6% |
| Two Or More | 5.2% | 4.4% | 4.3% |
| Hispanic | 29.0% | 40.2% | 19.3% |
Gender in Simi Valley
See the full breakdown
Simi Valley is 50.5% female with 63,470 female residents.
Simi Valley is 49.5% male with 62,163 male residents.
| Gender | Simi Valley | CA | USA |
|---|---|---|---|
| Female | 50.5% | 50.1% | 50.5% |
| Male | 49.5% | 49.9% | 49.5% |
Highest level of educational attainment in Simi Valley for adults over 25
See the full breakdown
4.0% of adults in Simi Valley completed < 9th grade.
5.0% of adults in Simi Valley completed 9-12th grade.
19.0% of adults in Simi Valley completed high school / ged.
22.0% of adults in Simi Valley completed some college.
11.0% of adults in Simi Valley completed associate's degree.
26.0% of adults in Simi Valley completed bachelor's degree.
10.0% of adults in Simi Valley completed master's degree.
2.0% of adults in Simi Valley completed professional degree.
1.0% of adults in Simi Valley completed doctorate degree.
| Education | Simi Valley | CA | USA |
|---|---|---|---|
| < 9th Grade | 4.0% | 8.0% | 4.0% |
| 9-12th Grade | 5.0% | 7.0% | 6.0% |
| High School / GED | 19.0% | 20.0% | 26.0% |
| Some College | 22.0% | 19.0% | 19.0% |
| Associate's Degree | 11.0% | 8.0% | 9.0% |
| Bachelor's Degree | 26.0% | 23.0% | 22.0% |
| Master's Degree | 10.0% | 10.0% | 10.0% |
| Professional Degree | 2.0% | 3.0% | 2.0% |
| Doctorate Degree | 1.0% | 2.0% | 2.0% |
Household Income For Simi Valley, California
See the full breakdown
2.9% of households in Simi Valley earn Less than $10,000.
1.3% of households in Simi Valley earn $10,000 to $14,999.
2.9% of households in Simi Valley earn $15,000 to $24,999.
4.7% of households in Simi Valley earn $25,000 to $34,999.
6.9% of households in Simi Valley earn $35,000 to $49,999.
10.7% of households in Simi Valley earn $50,000 to $74,999.
11.0% of households in Simi Valley earn $75,000 to $99,999.
20.2% of households in Simi Valley earn $100,000 to $149,999.
14.1% of households in Simi Valley earn $150,000 to $199,999.
25.2% of households in Simi Valley earn $200,000 or more.
| Income | Simi Valley | CA | USA |
|---|---|---|---|
| Less than $10,000 | 2.9% | 4.5% | 5.0% |
| $10,000 to $14,999 | 1.3% | 2.9% | 3.4% |
| $15,000 to $24,999 | 2.9% | 5.0% | 6.3% |
| $25,000 to $34,999 | 4.7% | 5.3% | 6.6% |
| $35,000 to $49,999 | 6.9% | 8.1% | 10.1% |
| $50,000 to $74,999 | 10.7% | 13.0% | 15.5% |
| $75,000 to $99,999 | 11.0% | 11.6% | 12.6% |
| $100,000 to $149,999 | 20.2% | 17.8% | 17.5% |
| $150,000 to $199,999 | 14.1% | 11.3% | 9.6% |
| $200,000 or more | 25.2% | 20.5% | 13.4% |
Source: U.S. Census ACS 5-year estimates (2024)


