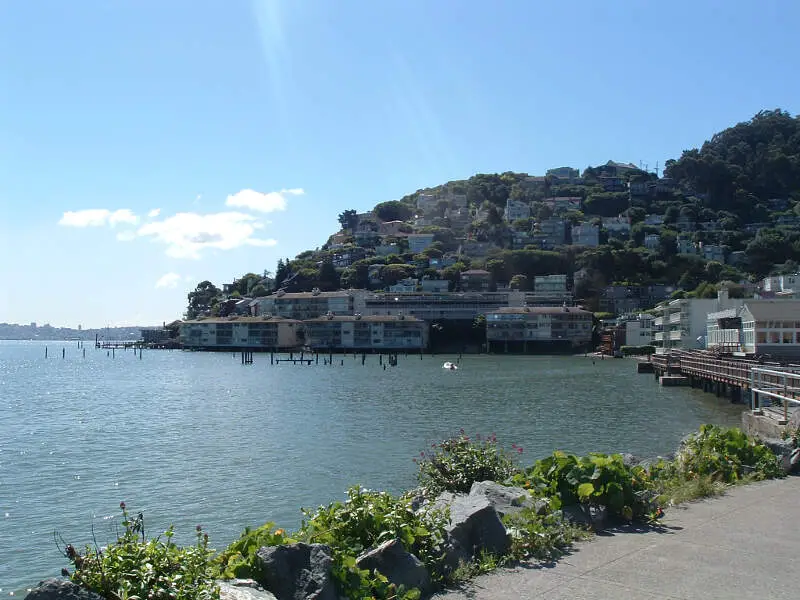
Sausalito, CA
Demographics And Statistics
Living In Sausalito, California Summary
Life in Sausalito research summary. HomeSnacks has been using Saturday Night Science to research the quality of life in Sausalito over the past nine years using Census, FBI, Zillow, and other primary data sources. Based on the most recently available data, we found the following about life in Sausalito:
The population in Sausalito is 7,171.
The median home value in Sausalito is $1,453,438.
The median income in Sausalito is $173,030.
The cost of living in Sausalito is 276 which is 2.8x higher than the national average.
The median rent in Sausalito is $3,408.
The unemployment rate in Sausalito is 7.7%.
The poverty rate in Sausalito is 7.6%.
The average high in Sausalito is 67.1° and the average low is 48.0°.
Sausalito SnackAbility
Overall SnackAbility
Sausalito, CA Crime Report
Crime in Sausalito summary. We use data from the FBI to determine the crime rates in Sausalito. Key points include:
There were 126 total crimes in Sausalito in the last reporting year.
The overall crime rate per 100,000 people in Sausalito is 1,814.3 / 100k people.
The violent crime rate per 100,000 people in Sausalito is 72.0 / 100k people.
The property crime rate per 100,000 people in Sausalito is 1,742.3 / 100k people.
Overall, crime in Sausalito is -14.39% below the national average.
Total Crimes
Below National Average
Crime In Sausalito Comparison Table
| Statistic | Count Raw |
Sausalito / 100k People |
California / 100k People |
National / 100k People |
|---|---|---|---|---|
| Total Crimes Per 100K | 126 | 1,814.3 | 2,564.5 | 2,119.2 |
| Violent Crime | 5 | 72.0 | 486.0 | 359.0 |
| Murder | 0 | 0.0 | 4.5 | 5.0 |
| Robbery | 0 | 0.0 | 119.1 | 61.0 |
| Aggravated Assault | 5 | 72.0 | 325.8 | 256.0 |
| Property Crime | 121 | 1,742.3 | 2,078.4 | 1,760.0 |
| Burglary | 17 | 244.8 | 305.8 | 229.0 |
| Larceny | 97 | 1,396.7 | 1,345.2 | 1,272.0 |
| Car Theft | 7 | 100.8 | 427.5 | 259.0 |
Sausalito, CA Cost Of Living
Cost of living in Sausalito summary. We use data on the cost of living to determine how expensive it is to live in Sausalito. Real estate prices drive most of the variance in cost of living around California. Key points include:
The cost of living in Sausalito is 276 with 100 being average.
The cost of living in Sausalito is 2.8x higher than the national average.
The median home value in Sausalito is $1,453,438.
The median income in Sausalito is $173,030.
Sausalito's Overall Cost Of Living
Higher Than The National Average
Cost Of Living In Sausalito Comparison Table
| Living Expense | Sausalito | California | National Average | |
|---|---|---|---|---|
| Overall | 276 | 141 | 100 | |
| Services | 121 | 110 | 100 | |
| Groceries | 124 | 112 | 100 | |
| Health | 123 | 110 | 100 | |
| Housing | 638 | 195 | 100 | |
| Transportation | 133 | 125 | 100 | |
| Utilities | 134 | 128 | 100 | |
Sausalito, CA Weather
The average high in Sausalito is 67.1° and the average low is 48.0°.
There are 49.9 days of precipitation each year.
Expect an average of 36.2 inches of precipitation each year with 0.0 inches of snow.
| Stat | Sausalito |
|---|---|
| Average Annual High | 67.1 |
| Average Annual Low | 48.0 |
| Annual Precipitation Days | 49.9 |
| Average Annual Precipitation | 36.2 |
| Average Annual Snowfall | 0.0 |
Average High
Days of Rain
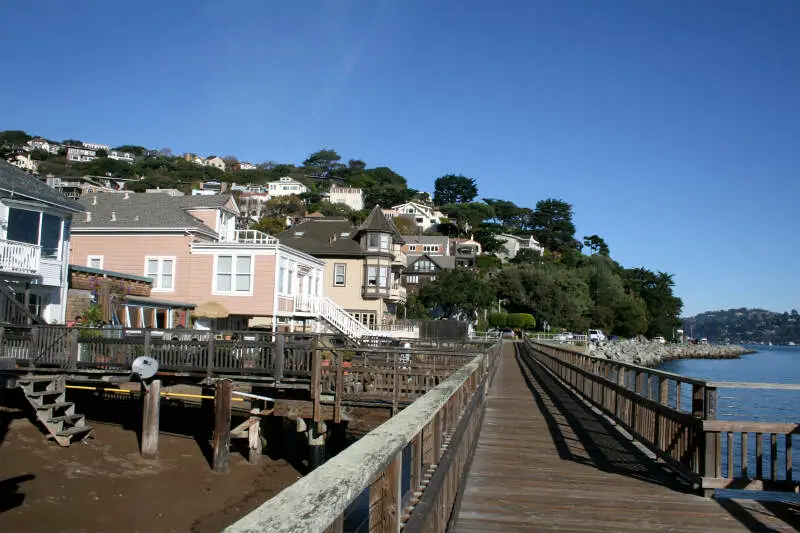
Sausalito, CA Photos


Rankings for Sausalito in California


Locations Around Sausalito
Map Of Sausalito, CA
Best Places Around Sausalito
Piedmont, CA
Population 11,012
San Bruno, CA
Population 42,612
Kensington, CA
Population 5,292
Lucas Valley-Marinwood, CA
Population 6,331
Millbrae, CA
Population 22,589
Fairfax, CA
Population 7,523
South San Francisco, CA
Population 64,487
Kentfield, CA
Population 7,128
Burlingame, CA
Population 30,526
Pacifica, CA
Population 37,527
Sausalito Demographics And Statistics
Population over time in Sausalito
The current population in Sausalito is 7,171. The population has increased 2.3% from 2010.
| Year | Population | % Change |
|---|---|---|
| 2023 | 7,171 | -0.9% |
| 2022 | 7,233 | -0.4% |
| 2021 | 7,260 | 1.2% |
| 2020 | 7,177 | 0.9% |
| 2019 | 7,116 | -0.3% |
| 2018 | 7,139 | -0.1% |
| 2017 | 7,147 | 0.4% |
| 2016 | 7,115 | 0.3% |
| 2015 | 7,094 | 0.7% |
| 2014 | 7,043 | 0.2% |
| 2013 | 7,029 | 0.4% |
| 2012 | 6,998 | -0.7% |
| 2011 | 7,047 | 0.5% |
| 2010 | 7,009 | - |
Race / Ethnicity in Sausalito
Sausalito is:
81.0% White with 5,810 White residents.
0.3% African American with 24 African American residents.
0.0% American Indian with 0 American Indian residents.
7.3% Asian with 522 Asian residents.
0.3% Hawaiian with 23 Hawaiian residents.
0.3% Other with 25 Other residents.
2.7% Two Or More with 194 Two Or More residents.
8.0% Hispanic with 573 Hispanic residents.
| Race | Sausalito | CA | USA |
|---|---|---|---|
| White | 81.0% | 34.6% | 58.2% |
| African American | 0.3% | 5.3% | 12.0% |
| American Indian | 0.0% | 0.3% | 0.5% |
| Asian | 7.3% | 15.1% | 5.7% |
| Hawaiian | 0.3% | 0.3% | 0.2% |
| Other | 0.3% | 0.5% | 0.5% |
| Two Or More | 2.7% | 4.1% | 3.9% |
| Hispanic | 8.0% | 39.8% | 19.0% |
Gender in Sausalito
Sausalito is 57.5% female with 4,123 female residents.
Sausalito is 42.5% male with 3,048 male residents.
| Gender | Sausalito | CA | USA |
|---|---|---|---|
| Female | 57.5% | 50.0% | 50.5% |
| Male | 42.5% | 50.0% | 49.5% |
Highest level of educational attainment in Sausalito for adults over 25
2.0% of adults in Sausalito completed < 9th grade.
0.0% of adults in Sausalito completed 9-12th grade.
5.0% of adults in Sausalito completed high school / ged.
12.0% of adults in Sausalito completed some college.
6.0% of adults in Sausalito completed associate's degree.
38.0% of adults in Sausalito completed bachelor's degree.
22.0% of adults in Sausalito completed master's degree.
12.0% of adults in Sausalito completed professional degree.
3.0% of adults in Sausalito completed doctorate degree.
| Education | Sausalito | CA | USA |
|---|---|---|---|
| < 9th Grade | 2.0% | 8.0% | 5.0% |
| 9-12th Grade | 0.0% | 7.0% | 6.0% |
| High School / GED | 5.0% | 20.0% | 26.0% |
| Some College | 12.0% | 20.0% | 19.0% |
| Associate's Degree | 6.0% | 8.0% | 9.0% |
| Bachelor's Degree | 38.0% | 22.0% | 21.0% |
| Master's Degree | 22.0% | 10.0% | 10.0% |
| Professional Degree | 12.0% | 3.0% | 2.0% |
| Doctorate Degree | 3.0% | 2.0% | 2.0% |
Household Income For Sausalito, California
2.3% of households in Sausalito earn Less than $10,000.
3.7% of households in Sausalito earn $10,000 to $14,999.
2.7% of households in Sausalito earn $15,000 to $24,999.
4.3% of households in Sausalito earn $25,000 to $34,999.
4.2% of households in Sausalito earn $35,000 to $49,999.
6.2% of households in Sausalito earn $50,000 to $74,999.
6.3% of households in Sausalito earn $75,000 to $99,999.
14.7% of households in Sausalito earn $100,000 to $149,999.
17.6% of households in Sausalito earn $150,000 to $199,999.
37.9% of households in Sausalito earn $200,000 or more.
| Income | Sausalito | CA | USA |
|---|---|---|---|
| Less than $10,000 | 2.3% | 4.4% | 4.9% |
| $10,000 to $14,999 | 3.7% | 3.0% | 3.6% |
| $15,000 to $24,999 | 2.7% | 5.2% | 6.6% |
| $25,000 to $34,999 | 4.3% | 5.5% | 6.8% |
| $35,000 to $49,999 | 4.2% | 8.4% | 10.4% |
| $50,000 to $74,999 | 6.2% | 13.3% | 15.7% |
| $75,000 to $99,999 | 6.3% | 11.8% | 12.7% |
| $100,000 to $149,999 | 14.7% | 17.9% | 17.4% |
| $150,000 to $199,999 | 17.6% | 11.1% | 9.3% |
| $200,000 or more | 37.9% | 19.4% | 12.6% |


