Solvang SnackAbility
Overall SnackAbility
Crime in Solvang summary. We use data from the FBI to determine the crime rates in Solvang. Key points include:
There were 59 total crimes in Solvang in the last reporting year.
The overall crime rate per 100,000 people in Solvang is 996.1 / 100k people.
The violent crime rate per 100,000 people in Solvang is 67.5 / 100k people.
The property crime rate per 100,000 people in Solvang is 928.6 / 100k people.
Overall, crime in Solvang is -53.00% below the national average.
Total Crimes
Below National Average
Crime In Solvang Comparison Table
| Statistic | Count Raw |
Solvang / 100k People |
California / 100k People |
National / 100k People |
|---|---|---|---|---|
| Total Crimes Per 100K | 59 | 996.1 | 2,564.5 | 2,119.2 |
| Violent Crime | 4 | 67.5 | 486.0 | 359.0 |
| Murder | 0 | 0.0 | 4.5 | 5.0 |
| Robbery | 0 | 0.0 | 119.1 | 61.0 |
| Aggravated Assault | 3 | 50.7 | 325.8 | 256.0 |
| Property Crime | 55 | 928.6 | 2,078.4 | 1,760.0 |
| Burglary | 10 | 168.8 | 305.8 | 229.0 |
| Larceny | 40 | 675.3 | 1,345.2 | 1,272.0 |
| Car Theft | 5 | 84.4 | 427.5 | 259.0 |
Source: FBI Uniform Crime Reporting (2024)
Cost of living in Solvang summary. We use data on the cost of living to determine how expensive it is to live in Solvang. Real estate prices drive most of the variance in cost of living around California. Key points include:
The cost of living in Solvang is 174 with 100 being average.
The cost of living in Solvang is 1.7x higher than the national average.
The median home value in Solvang is $1,410,758.
The median income in Solvang is $109,091.
Solvang's Overall Cost Of Living
Higher Than The National Average
Cost Of Living In Solvang Comparison Table
| Living Expense | Solvang | California | National Average |
|---|---|---|---|
| Overall | 174 | 142 | 100 |
| Services | 108 | 110 | 100 |
| Groceries | 112 | 118 | 100 |
| Health | 316 | 197 | 100 |
| Housing | 111 | 120 | 100 |
| Transportation | 114 | 121 | 100 |
| Utilities | 121 | 121 | 100 |
Source: Cost of living index, normalized to US average = 100
Solvang, CA Weather
The average high in Solvang is 69.8° and the average low is 48.8°.
There are 27.0 days of precipitation each year.
Expect an average of 18.1 inches of precipitation each year with 0.0 inches of snow.
| Stat | Solvang |
|---|---|
| Average Annual High | 69.8 |
| Average Annual Low | 48.8 |
| Annual Precipitation Days | 27.0 |
| Average Annual Precipitation | 18.1 |
| Average Annual Snowfall | 0.0 |
Average High
Days of Rain
Source: NOAA climate normals (30-year)
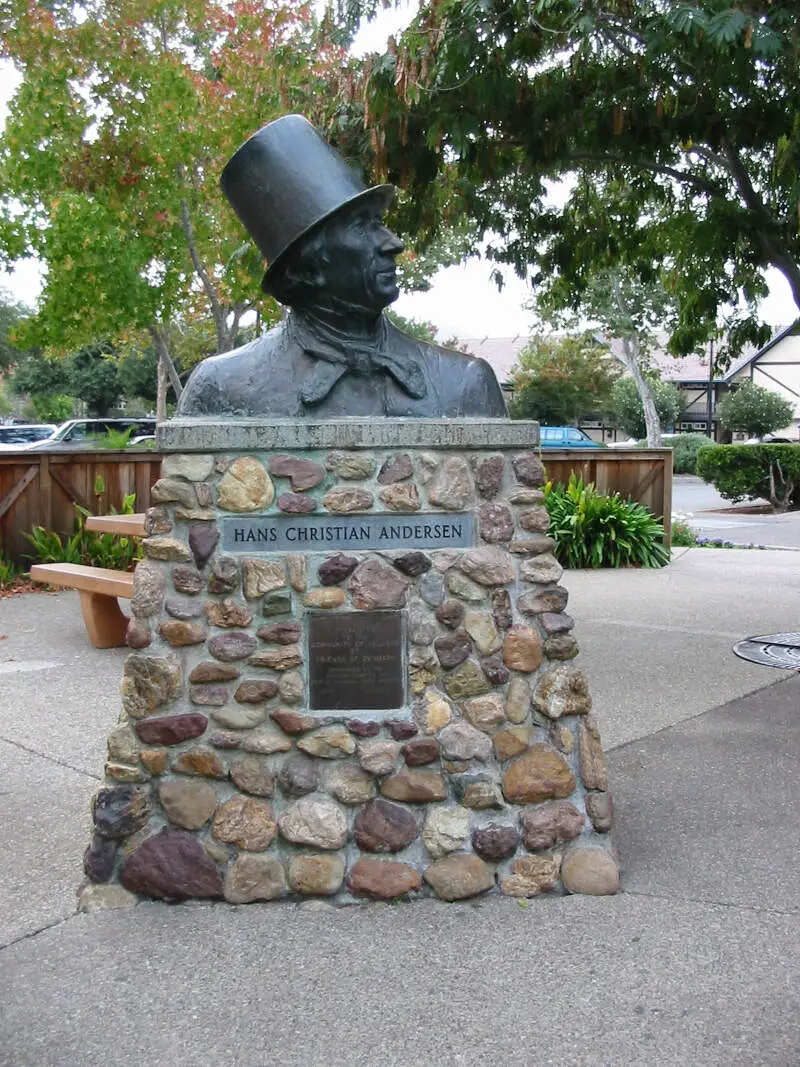
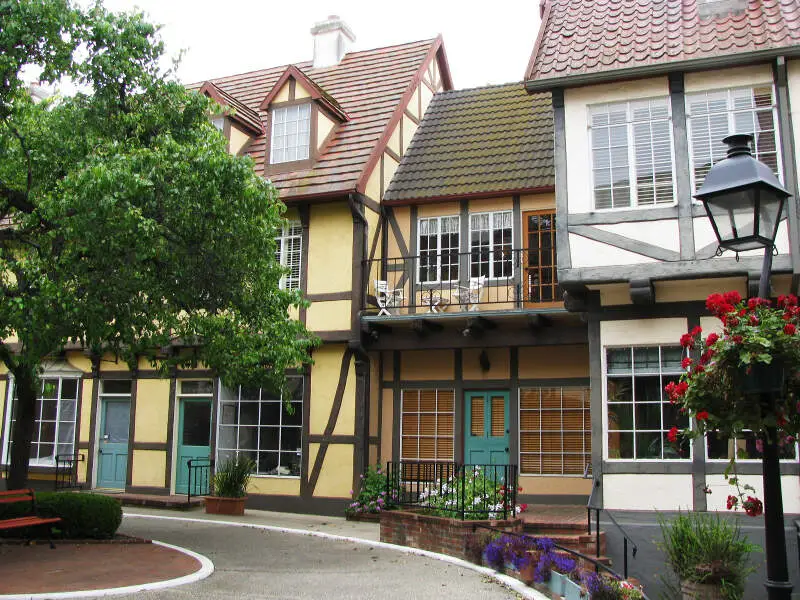
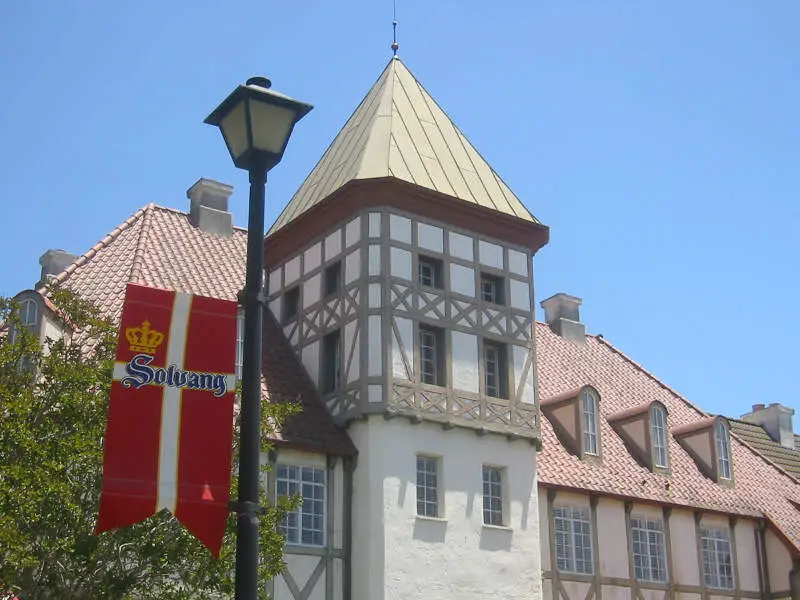
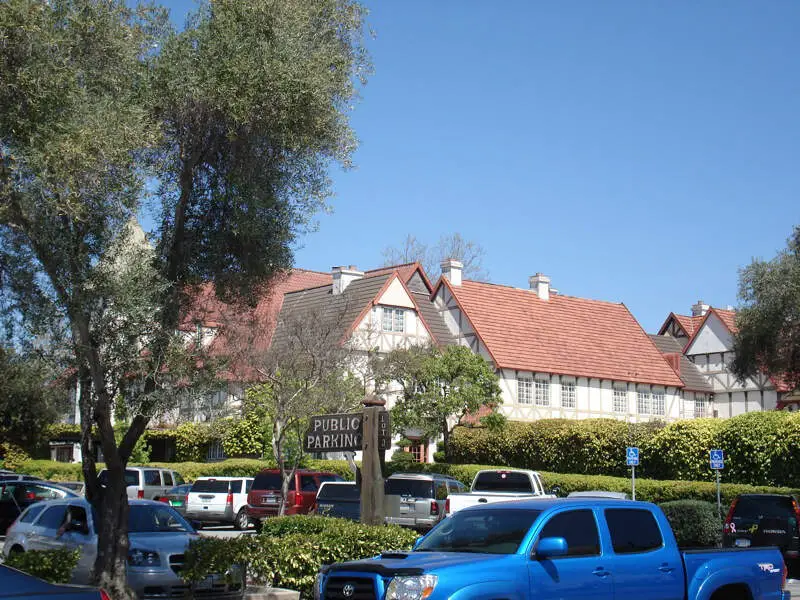
Solvang, CA Photos


Rankings & Articles For Solvang


Locations Around Solvang
Map Of Solvang, CA
Best Places Around Solvang
Guadalupe, CA
Population 8,566
Goleta, CA
Population 32,685
Orcutt, CA
Population 31,454
Nipomo, CA
Population 17,516
Grover Beach, CA
Population 12,604
Carpinteria, CA
Population 13,036
Santa Barbara, CA
Population 87,779
Arroyo Grande, CA
Population 18,372
Oceano, CA
Population 7,128
Isla Vista, CA
Population 13,920
Solvang Demographics And Statistics
Population over time in Solvang
The current population in Solvang is 6,034. The population has increased 15.6% from 2010.
| Year | Population | % Change |
|---|---|---|
| 2024 | 6,034 | 0.0% |
| 2023 | 6,034 | -0.0% |
| 2022 | 6,035 | 0.0% |
| 2021 | 6,032 | 6.9% |
| 2020 | 5,644 | -2.8% |
| 2019 | 5,804 | 1.2% |
| 2018 | 5,734 | 1.5% |
| 2017 | 5,650 | 1.8% |
| 2016 | 5,552 | 1.8% |
| 2015 | 5,456 | 2.1% |
| 2014 | 5,345 | 0.9% |
| 2013 | 5,298 | 0.7% |
| 2012 | 5,261 | 0.5% |
| 2011 | 5,237 | 0.4% |
| 2010 | 5,218 | - |
Race / Ethnicity in Solvang
See the full breakdown
Solvang is:
61.1% White with 3,688 White residents.
2.7% African American with 161 African American residents.
0.0% American Indian with 0 American Indian residents.
2.9% Asian with 176 Asian residents.
0.9% Hawaiian with 52 Hawaiian residents.
0.6% Other with 37 Other residents.
6.4% Two Or More with 388 Two Or More residents.
25.4% Hispanic with 1,532 Hispanic residents.
| Race | Solvang | CA | USA |
|---|---|---|---|
| White | 61.1% | 33.8% | 57.4% |
| African American | 2.7% | 5.2% | 11.9% |
| American Indian | 0.0% | 0.3% | 0.5% |
| Asian | 2.9% | 15.3% | 5.9% |
| Hawaiian | 0.9% | 0.3% | 0.2% |
| Other | 0.6% | 0.6% | 0.6% |
| Two Or More | 6.4% | 4.4% | 4.3% |
| Hispanic | 25.4% | 40.2% | 19.3% |
Gender in Solvang
See the full breakdown
Solvang is 54.8% female with 3,305 female residents.
Solvang is 45.2% male with 2,729 male residents.
| Gender | Solvang | CA | USA |
|---|---|---|---|
| Female | 54.8% | 50.1% | 50.5% |
| Male | 45.2% | 49.9% | 49.5% |
Highest level of educational attainment in Solvang for adults over 25
See the full breakdown
6.0% of adults in Solvang completed < 9th grade.
2.0% of adults in Solvang completed 9-12th grade.
17.0% of adults in Solvang completed high school / ged.
26.0% of adults in Solvang completed some college.
10.0% of adults in Solvang completed associate's degree.
25.0% of adults in Solvang completed bachelor's degree.
9.0% of adults in Solvang completed master's degree.
3.0% of adults in Solvang completed professional degree.
2.0% of adults in Solvang completed doctorate degree.
| Education | Solvang | CA | USA |
|---|---|---|---|
| < 9th Grade | 6.0% | 8.0% | 4.0% |
| 9-12th Grade | 2.0% | 7.0% | 6.0% |
| High School / GED | 17.0% | 20.0% | 26.0% |
| Some College | 26.0% | 19.0% | 19.0% |
| Associate's Degree | 10.0% | 8.0% | 9.0% |
| Bachelor's Degree | 25.0% | 23.0% | 22.0% |
| Master's Degree | 9.0% | 10.0% | 10.0% |
| Professional Degree | 3.0% | 3.0% | 2.0% |
| Doctorate Degree | 2.0% | 2.0% | 2.0% |
Household Income For Solvang, California
See the full breakdown
2.1% of households in Solvang earn Less than $10,000.
4.3% of households in Solvang earn $10,000 to $14,999.
4.4% of households in Solvang earn $15,000 to $24,999.
6.2% of households in Solvang earn $25,000 to $34,999.
5.5% of households in Solvang earn $35,000 to $49,999.
10.3% of households in Solvang earn $50,000 to $74,999.
14.4% of households in Solvang earn $75,000 to $99,999.
19.7% of households in Solvang earn $100,000 to $149,999.
14.1% of households in Solvang earn $150,000 to $199,999.
19.0% of households in Solvang earn $200,000 or more.
| Income | Solvang | CA | USA |
|---|---|---|---|
| Less than $10,000 | 2.1% | 4.5% | 5.0% |
| $10,000 to $14,999 | 4.3% | 2.9% | 3.4% |
| $15,000 to $24,999 | 4.4% | 5.0% | 6.3% |
| $25,000 to $34,999 | 6.2% | 5.3% | 6.6% |
| $35,000 to $49,999 | 5.5% | 8.1% | 10.1% |
| $50,000 to $74,999 | 10.3% | 13.0% | 15.5% |
| $75,000 to $99,999 | 14.4% | 11.6% | 12.6% |
| $100,000 to $149,999 | 19.7% | 17.8% | 17.5% |
| $150,000 to $199,999 | 14.1% | 11.3% | 9.6% |
| $200,000 or more | 19.0% | 20.5% | 13.4% |
Source: U.S. Census ACS 5-year estimates (2024)


