Compare Santa Barbara to…
Santa Barbara SnackAbility
Overall SnackAbility
Crime in Santa Barbara summary. We use data from the FBI to determine the crime rates in Santa Barbara. Key points include:
There were 2,108 total crimes in Santa Barbara in the last reporting year.
The overall crime rate per 100,000 people in Santa Barbara is 2,458.1 / 100k people.
The violent crime rate per 100,000 people in Santa Barbara is 648.3 / 100k people.
The property crime rate per 100,000 people in Santa Barbara is 1,809.7 / 100k people.
Overall, crime in Santa Barbara is 15.99% above the national average.
Total Crimes
Above National Average
Crime In Santa Barbara Comparison Table
| Statistic | Count Raw |
Santa Barbara / 100k People |
California / 100k People |
National / 100k People |
|---|---|---|---|---|
| Total Crimes Per 100K | 2,108 | 2,458.1 | 2,564.5 | 2,119.2 |
| Violent Crime | 556 | 648.3 | 486.0 | 359.0 |
| Murder | 0 | 0.0 | 4.5 | 5.0 |
| Robbery | 64 | 74.6 | 119.1 | 61.0 |
| Aggravated Assault | 421 | 490.9 | 325.8 | 256.0 |
| Property Crime | 1,552 | 1,809.7 | 2,078.4 | 1,760.0 |
| Burglary | 146 | 170.2 | 305.8 | 229.0 |
| Larceny | 1,236 | 1,441.3 | 1,345.2 | 1,272.0 |
| Car Theft | 170 | 198.2 | 427.5 | 259.0 |
Source: FBI Uniform Crime Reporting (2024)
Cost of living in Santa Barbara summary. We use data on the cost of living to determine how expensive it is to live in Santa Barbara. Real estate prices drive most of the variance in cost of living around California. Key points include:
The cost of living in Santa Barbara is 223 with 100 being average.
The cost of living in Santa Barbara is 2.2x higher than the national average.
The median home value in Santa Barbara is $1,834,094.
The median income in Santa Barbara is $106,182.
Santa Barbara's Overall Cost Of Living
Higher Than The National Average
Cost Of Living In Santa Barbara Comparison Table
| Living Expense | Santa Barbara | California | National Average |
|---|---|---|---|
| Overall | 223 | 142 | 100 |
| Services | 111 | 110 | 100 |
| Groceries | 115 | 118 | 100 |
| Health | 470 | 197 | 100 |
| Housing | 118 | 120 | 100 |
| Transportation | 122 | 121 | 100 |
| Utilities | 127 | 121 | 100 |
Source: Cost of living index, normalized to US average = 100
Santa Barbara, CA Weather
The average high in Santa Barbara is 69.8° and the average low is 48.8°.
There are 27.0 days of precipitation each year.
Expect an average of 18.1 inches of precipitation each year with 0.0 inches of snow.
| Stat | Santa Barbara |
|---|---|
| Average Annual High | 69.8 |
| Average Annual Low | 48.8 |
| Annual Precipitation Days | 27.0 |
| Average Annual Precipitation | 18.1 |
| Average Annual Snowfall | 0.0 |
Average High
Days of Rain
Source: NOAA climate normals (30-year)
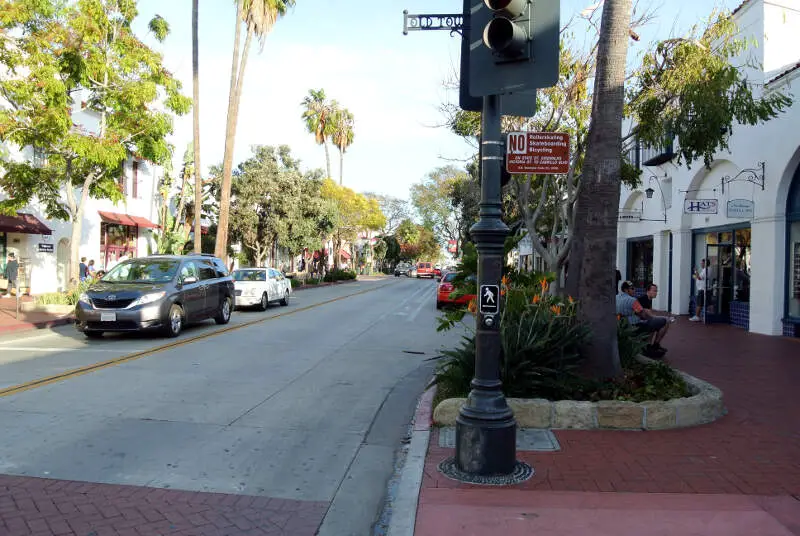
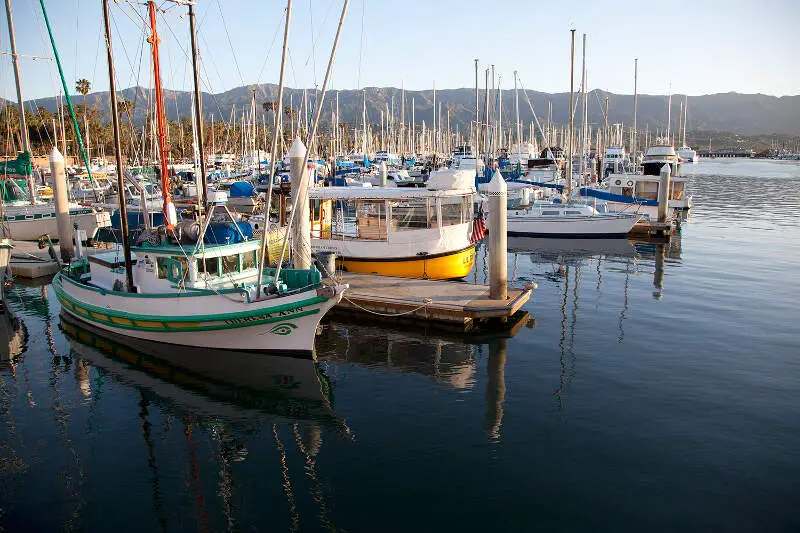
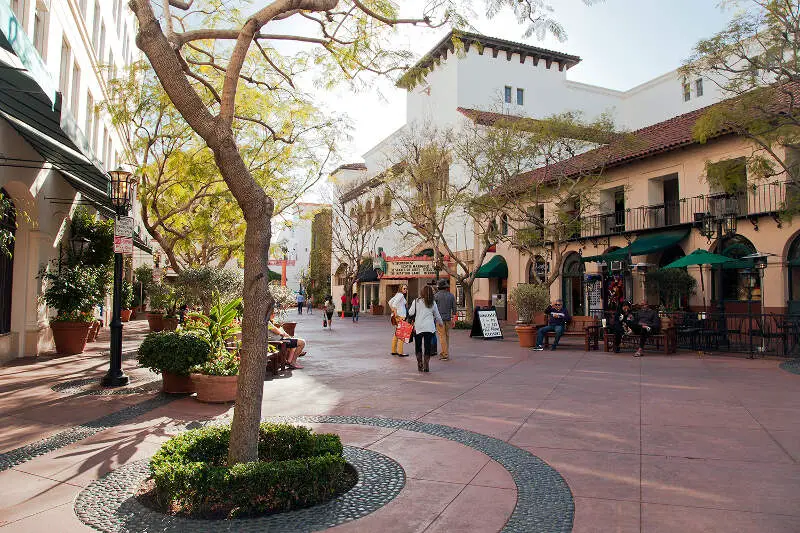
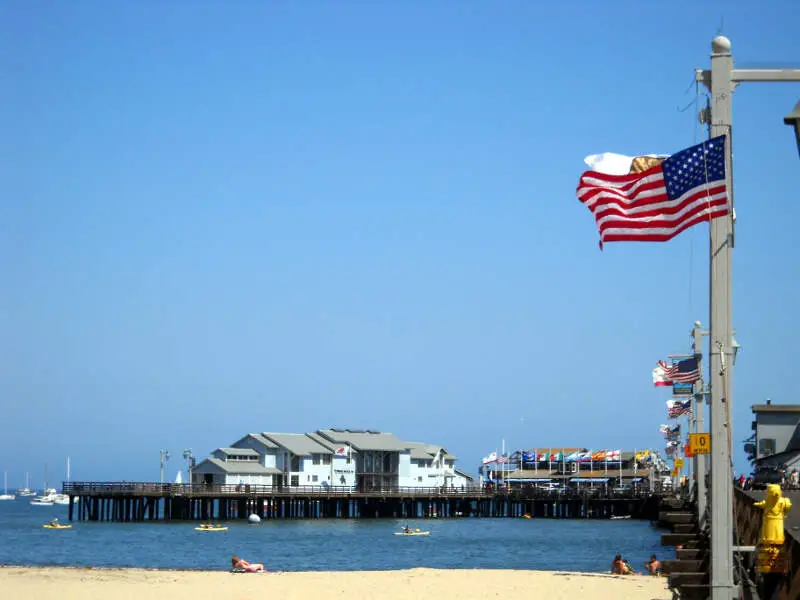
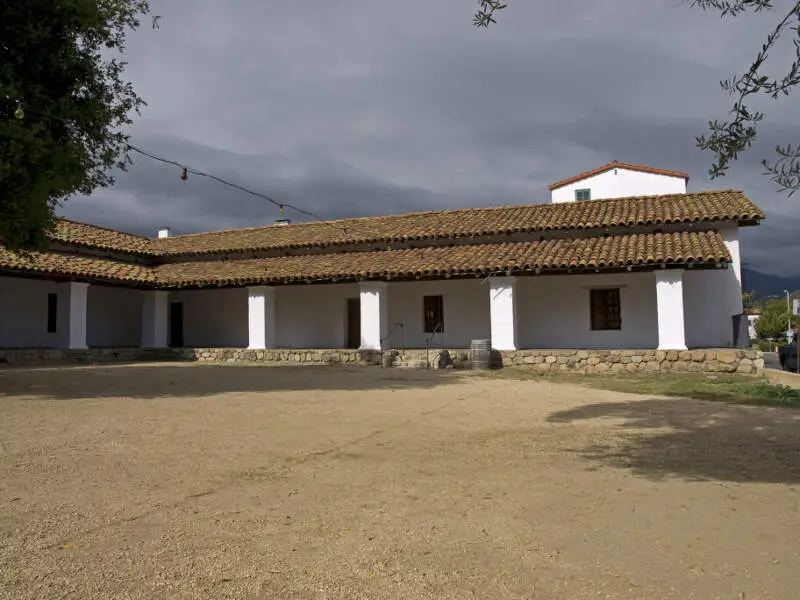
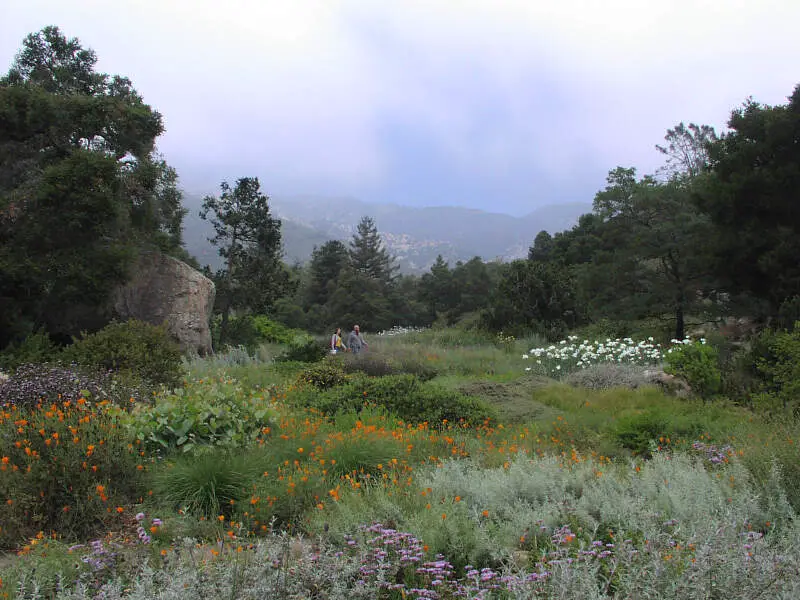
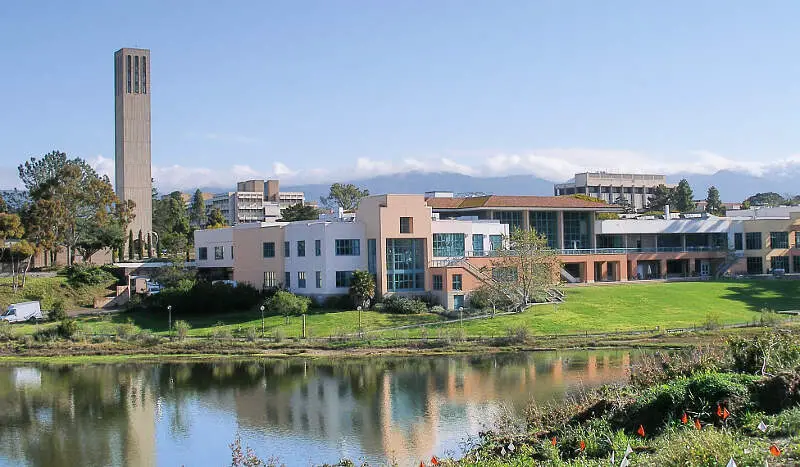
Santa Barbara, CA Photos


1 Reviews & Comments About Santa Barbara

You haven't lived until you've lived in Santa Barbara. The beach is minutes from everything, people are diverse and friendly, and the food options are numerous. This is a great place to live or visit and to raise a family.
Home prices are through the roof, but that is the same all over the state. One of our favorite activities is the art walk which takes place on the beach each weekend. Locals sell goods all along the pathway, it's a great experience to shop at.
Rankings & Articles For Santa Barbara


Locations Around Santa Barbara
Map Of Santa Barbara, CA
Best Places Around Santa Barbara
Goleta, CA
Population 32,685
Camarillo, CA
Population 70,186
Moorpark, CA
Population 35,854
Solvang, CA
Population 6,034
Thousand Oaks, CA
Population 125,205
Carpinteria, CA
Population 13,036
Isla Vista, CA
Population 13,920
Fillmore, CA
Population 16,816
Mira Monte, CA
Population 6,888
Oxnard, CA
Population 200,928
Santa Barbara Demographics And Statistics
Population over time in Santa Barbara
The current population in Santa Barbara is 87,779. The population has decreased 0.1% from 2010.
| Year | Population | % Change |
|---|---|---|
| 2024 | 87,779 | -0.3% |
| 2023 | 88,024 | -0.7% |
| 2022 | 88,640 | -0.6% |
| 2021 | 89,132 | -2.0% |
| 2020 | 90,911 | -0.5% |
| 2019 | 91,376 | 0.1% |
| 2018 | 91,325 | -0.1% |
| 2017 | 91,443 | 0.6% |
| 2016 | 90,922 | 0.6% |
| 2015 | 90,401 | 0.8% |
| 2014 | 89,669 | 0.7% |
| 2013 | 89,062 | 0.6% |
| 2012 | 88,572 | 0.4% |
| 2011 | 88,192 | 0.4% |
| 2010 | 87,859 | - |
Race / Ethnicity in Santa Barbara
See the full breakdown
Santa Barbara is:
52.8% White with 46,347 White residents.
1.4% African American with 1,219 African American residents.
0.3% American Indian with 302 American Indian residents.
3.5% Asian with 3,109 Asian residents.
0.1% Hawaiian with 73 Hawaiian residents.
1.0% Other with 911 Other residents.
4.4% Two Or More with 3,852 Two Or More residents.
36.4% Hispanic with 31,966 Hispanic residents.
| Race | Santa Barbara | CA | USA |
|---|---|---|---|
| White | 52.8% | 33.8% | 57.4% |
| African American | 1.4% | 5.2% | 11.9% |
| American Indian | 0.3% | 0.3% | 0.5% |
| Asian | 3.5% | 15.3% | 5.9% |
| Hawaiian | 0.1% | 0.3% | 0.2% |
| Other | 1.0% | 0.6% | 0.6% |
| Two Or More | 4.4% | 4.4% | 4.3% |
| Hispanic | 36.4% | 40.2% | 19.3% |
Gender in Santa Barbara
See the full breakdown
Santa Barbara is 50.7% female with 44,546 female residents.
Santa Barbara is 49.3% male with 43,232 male residents.
| Gender | Santa Barbara | CA | USA |
|---|---|---|---|
| Female | 50.7% | 50.1% | 50.5% |
| Male | 49.3% | 49.9% | 49.5% |
Highest level of educational attainment in Santa Barbara for adults over 25
See the full breakdown
7.0% of adults in Santa Barbara completed < 9th grade.
4.0% of adults in Santa Barbara completed 9-12th grade.
12.0% of adults in Santa Barbara completed high school / ged.
18.0% of adults in Santa Barbara completed some college.
7.0% of adults in Santa Barbara completed associate's degree.
30.0% of adults in Santa Barbara completed bachelor's degree.
13.0% of adults in Santa Barbara completed master's degree.
5.0% of adults in Santa Barbara completed professional degree.
4.0% of adults in Santa Barbara completed doctorate degree.
| Education | Santa Barbara | CA | USA |
|---|---|---|---|
| < 9th Grade | 7.0% | 8.0% | 4.0% |
| 9-12th Grade | 4.0% | 7.0% | 6.0% |
| High School / GED | 12.0% | 20.0% | 26.0% |
| Some College | 18.0% | 19.0% | 19.0% |
| Associate's Degree | 7.0% | 8.0% | 9.0% |
| Bachelor's Degree | 30.0% | 23.0% | 22.0% |
| Master's Degree | 13.0% | 10.0% | 10.0% |
| Professional Degree | 5.0% | 3.0% | 2.0% |
| Doctorate Degree | 4.0% | 2.0% | 2.0% |
Household Income For Santa Barbara, California
See the full breakdown
4.9% of households in Santa Barbara earn Less than $10,000.
2.8% of households in Santa Barbara earn $10,000 to $14,999.
5.5% of households in Santa Barbara earn $15,000 to $24,999.
4.3% of households in Santa Barbara earn $25,000 to $34,999.
6.7% of households in Santa Barbara earn $35,000 to $49,999.
12.1% of households in Santa Barbara earn $50,000 to $74,999.
10.0% of households in Santa Barbara earn $75,000 to $99,999.
15.6% of households in Santa Barbara earn $100,000 to $149,999.
12.4% of households in Santa Barbara earn $150,000 to $199,999.
25.8% of households in Santa Barbara earn $200,000 or more.
| Income | Santa Barbara | CA | USA |
|---|---|---|---|
| Less than $10,000 | 4.9% | 4.5% | 5.0% |
| $10,000 to $14,999 | 2.8% | 2.9% | 3.4% |
| $15,000 to $24,999 | 5.5% | 5.0% | 6.3% |
| $25,000 to $34,999 | 4.3% | 5.3% | 6.6% |
| $35,000 to $49,999 | 6.7% | 8.1% | 10.1% |
| $50,000 to $74,999 | 12.1% | 13.0% | 15.5% |
| $75,000 to $99,999 | 10.0% | 11.6% | 12.6% |
| $100,000 to $149,999 | 15.6% | 17.8% | 17.5% |
| $150,000 to $199,999 | 12.4% | 11.3% | 9.6% |
| $200,000 or more | 25.8% | 20.5% | 13.4% |
Source: U.S. Census ACS 5-year estimates (2024)


