Compare Stockton to…
Stockton SnackAbility
Overall SnackAbility
Crime in Stockton summary. We use data from the FBI to determine the crime rates in Stockton. Key points include:
There were 12,078 total crimes in Stockton in the last reporting year.
The overall crime rate per 100,000 people in Stockton is 3,785.4 / 100k people.
The violent crime rate per 100,000 people in Stockton is 1,145.8 / 100k people.
The property crime rate per 100,000 people in Stockton is 2,639.6 / 100k people.
Overall, crime in Stockton is 78.62% above the national average.
Total Crimes
Above National Average
Crime In Stockton Comparison Table
| Statistic | Count Raw |
Stockton / 100k People |
California / 100k People |
National / 100k People |
|---|---|---|---|---|
| Total Crimes Per 100K | 12,078 | 3,785.4 | 2,564.5 | 2,119.2 |
| Violent Crime | 3,656 | 1,145.8 | 486.0 | 359.0 |
| Murder | 51 | 16.0 | 4.5 | 5.0 |
| Robbery | 1,073 | 336.3 | 119.1 | 61.0 |
| Aggravated Assault | 2,403 | 753.1 | 325.8 | 256.0 |
| Property Crime | 8,422 | 2,639.6 | 2,078.4 | 1,760.0 |
| Burglary | 1,794 | 562.3 | 305.8 | 229.0 |
| Larceny | 4,697 | 1,472.1 | 1,345.2 | 1,272.0 |
| Car Theft | 1,931 | 605.2 | 427.5 | 259.0 |
Source: FBI Uniform Crime Reporting (2024)
Cost of living in Stockton summary. We use data on the cost of living to determine how expensive it is to live in Stockton. Real estate prices drive most of the variance in cost of living around California. Key points include:
The cost of living in Stockton is 126 with 100 being average.
The cost of living in Stockton is 1.3x higher than the national average.
The median home value in Stockton is $431,328.
The median income in Stockton is $79,907.
Stockton's Overall Cost Of Living
Higher Than The National Average
Cost Of Living In Stockton Comparison Table
| Living Expense | Stockton | California | National Average |
|---|---|---|---|
| Overall | 126 | 142 | 100 |
| Services | 111 | 110 | 100 |
| Groceries | 113 | 118 | 100 |
| Health | 151 | 197 | 100 |
| Housing | 123 | 120 | 100 |
| Transportation | 118 | 121 | 100 |
| Utilities | 124 | 121 | 100 |
Source: Cost of living index, normalized to US average = 100
Stockton, CA Weather
The average high in Stockton is 74.6° and the average low is 48.6°.
There are 39.6 days of precipitation each year.
Expect an average of 15.0 inches of precipitation each year with 0.0 inches of snow.
| Stat | Stockton |
|---|---|
| Average Annual High | 74.6 |
| Average Annual Low | 48.6 |
| Annual Precipitation Days | 39.6 |
| Average Annual Precipitation | 15.0 |
| Average Annual Snowfall | 0.0 |
Average High
Days of Rain
Source: NOAA climate normals (30-year)
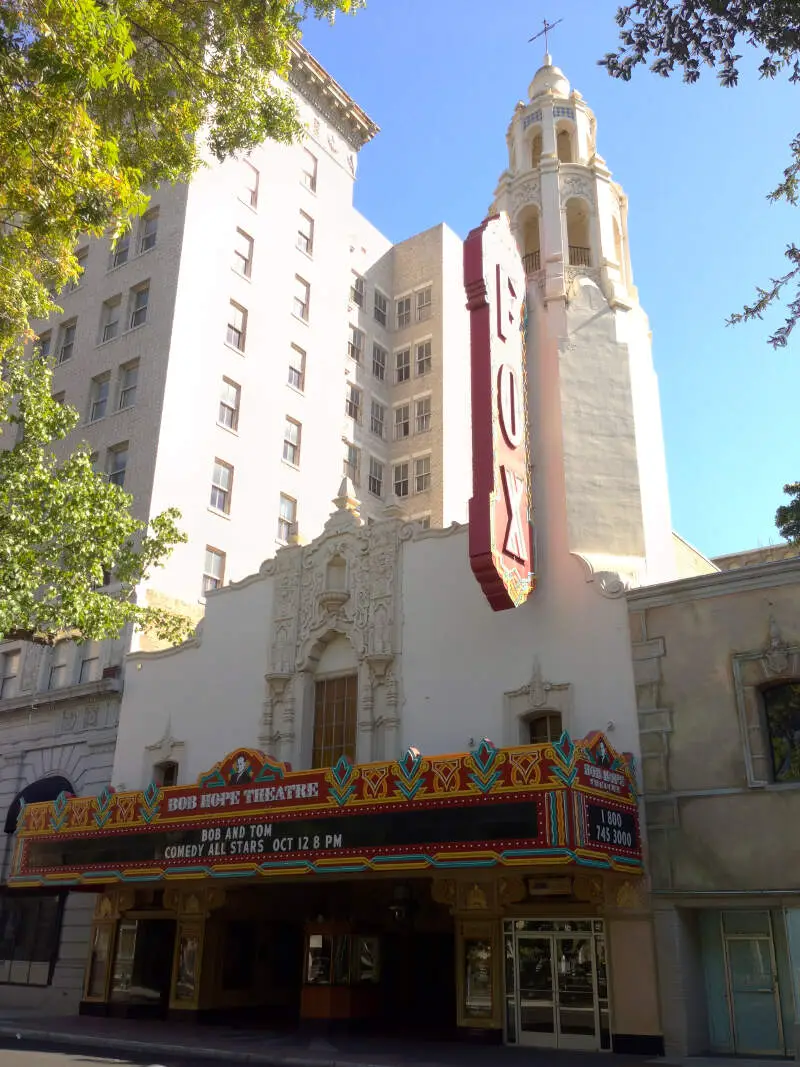
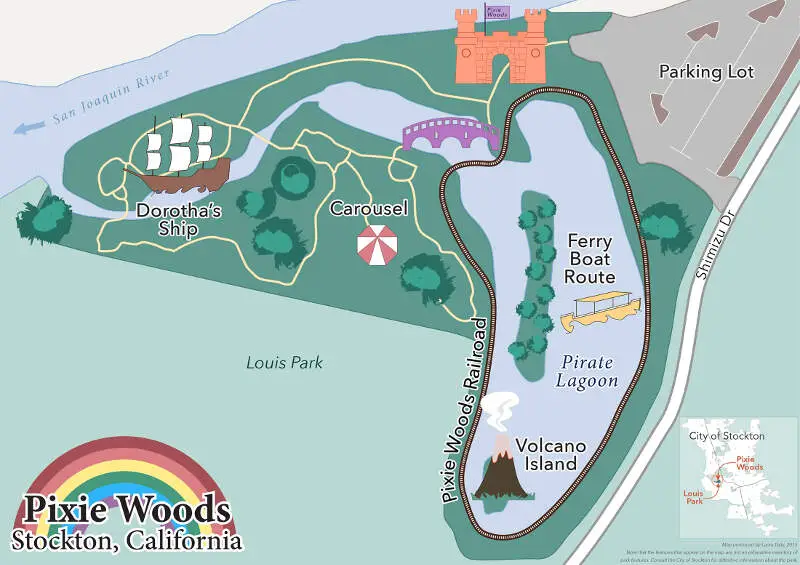
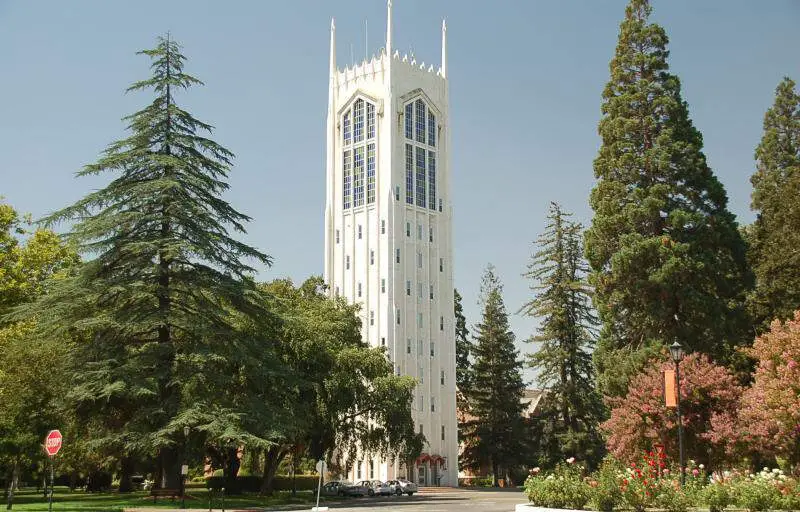
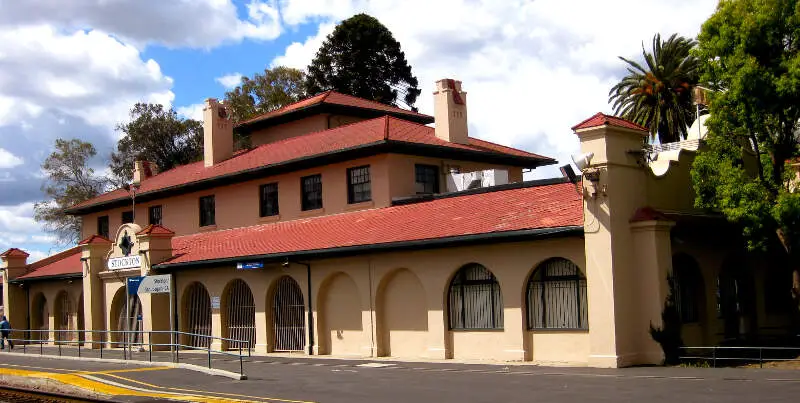
Stockton, CA Photos


1 Reviews & Comments About Stockton

The crime has been exploding and soemtimes i am scared to leave my house. the homeless population has definitley exploded over the last few years are every where. the city doesnt care about the well being of any citizens outside of the rich. and white people are racist but dont admit it. Theres little to do for teenagers.
Be careful going downtown especially by the movie theater, there are a lot of drug addicts, mentally ill homeless and pimps that stroll the promenade. genova bakery has some amzing break and we have the best taco truck in the nation. Mayitas sometimes has long lines but its worth it!
Rankings & Articles For Stockton


Locations Around Stockton
Map Of Stockton, CA
Best Places Around Stockton
Ripon, CA
Population 16,201
Tracy, CA
Population 96,966
Discovery Bay, CA
Population 14,911
Lodi, CA
Population 67,607
Country Club, CA
Population 10,161
Lincoln, CA
Population 52,956
Manteca, CA
Population 89,043
Mountain House, CA
Population 25,513
Lathrop, CA
Population 35,052
August, CA
Population 8,825
Stockton Demographics And Statistics
Population over time in Stockton
The current population in Stockton is 322,326. The population has increased 12.2% from 2010.
| Year | Population | % Change |
|---|---|---|
| 2024 | 322,326 | 0.6% |
| 2023 | 320,470 | 0.1% |
| 2022 | 320,030 | 0.7% |
| 2021 | 317,818 | 2.2% |
| 2020 | 311,103 | 0.6% |
| 2019 | 309,228 | 1.0% |
| 2018 | 306,283 | 0.6% |
| 2017 | 304,358 | 1.0% |
| 2016 | 301,443 | 0.6% |
| 2015 | 299,722 | 0.8% |
| 2014 | 297,223 | 1.0% |
| 2013 | 294,406 | 0.7% |
| 2012 | 292,262 | 0.8% |
| 2011 | 289,926 | 0.9% |
| 2010 | 287,377 | - |
Race / Ethnicity in Stockton
See the full breakdown
Stockton is:
16.8% White with 54,225 White residents.
10.8% African American with 34,746 African American residents.
0.4% American Indian with 1,162 American Indian residents.
20.8% Asian with 66,946 Asian residents.
0.6% Hawaiian with 1,833 Hawaiian residents.
0.5% Other with 1,541 Other residents.
4.6% Two Or More with 14,753 Two Or More residents.
45.6% Hispanic with 147,120 Hispanic residents.
| Race | Stockton | CA | USA |
|---|---|---|---|
| White | 16.8% | 33.8% | 57.4% |
| African American | 10.8% | 5.2% | 11.9% |
| American Indian | 0.4% | 0.3% | 0.5% |
| Asian | 20.8% | 15.3% | 5.9% |
| Hawaiian | 0.6% | 0.3% | 0.2% |
| Other | 0.5% | 0.6% | 0.6% |
| Two Or More | 4.6% | 4.4% | 4.3% |
| Hispanic | 45.6% | 40.2% | 19.3% |
Gender in Stockton
See the full breakdown
Stockton is 51.3% female with 165,428 female residents.
Stockton is 48.7% male with 156,898 male residents.
| Gender | Stockton | CA | USA |
|---|---|---|---|
| Female | 51.3% | 50.1% | 50.5% |
| Male | 48.7% | 49.9% | 49.5% |
Highest level of educational attainment in Stockton for adults over 25
See the full breakdown
13.0% of adults in Stockton completed < 9th grade.
9.0% of adults in Stockton completed 9-12th grade.
28.0% of adults in Stockton completed high school / ged.
21.0% of adults in Stockton completed some college.
9.0% of adults in Stockton completed associate's degree.
14.0% of adults in Stockton completed bachelor's degree.
4.0% of adults in Stockton completed master's degree.
1.0% of adults in Stockton completed professional degree.
1.0% of adults in Stockton completed doctorate degree.
| Education | Stockton | CA | USA |
|---|---|---|---|
| < 9th Grade | 13.0% | 8.0% | 4.0% |
| 9-12th Grade | 9.0% | 7.0% | 6.0% |
| High School / GED | 28.0% | 20.0% | 26.0% |
| Some College | 21.0% | 19.0% | 19.0% |
| Associate's Degree | 9.0% | 8.0% | 9.0% |
| Bachelor's Degree | 14.0% | 23.0% | 22.0% |
| Master's Degree | 4.0% | 10.0% | 10.0% |
| Professional Degree | 1.0% | 3.0% | 2.0% |
| Doctorate Degree | 1.0% | 2.0% | 2.0% |
Household Income For Stockton, California
See the full breakdown
4.9% of households in Stockton earn Less than $10,000.
4.1% of households in Stockton earn $10,000 to $14,999.
5.9% of households in Stockton earn $15,000 to $24,999.
6.6% of households in Stockton earn $25,000 to $34,999.
10.0% of households in Stockton earn $35,000 to $49,999.
15.6% of households in Stockton earn $50,000 to $74,999.
14.6% of households in Stockton earn $75,000 to $99,999.
18.7% of households in Stockton earn $100,000 to $149,999.
10.3% of households in Stockton earn $150,000 to $199,999.
9.3% of households in Stockton earn $200,000 or more.
| Income | Stockton | CA | USA |
|---|---|---|---|
| Less than $10,000 | 4.9% | 4.5% | 5.0% |
| $10,000 to $14,999 | 4.1% | 2.9% | 3.4% |
| $15,000 to $24,999 | 5.9% | 5.0% | 6.3% |
| $25,000 to $34,999 | 6.6% | 5.3% | 6.6% |
| $35,000 to $49,999 | 10.0% | 8.1% | 10.1% |
| $50,000 to $74,999 | 15.6% | 13.0% | 15.5% |
| $75,000 to $99,999 | 14.6% | 11.6% | 12.6% |
| $100,000 to $149,999 | 18.7% | 17.8% | 17.5% |
| $150,000 to $199,999 | 10.3% | 11.3% | 9.6% |
| $200,000 or more | 9.3% | 20.5% | 13.4% |
Source: U.S. Census ACS 5-year estimates (2024)


