Wasco SnackAbility
Overall SnackAbility
Cost of living in Wasco summary. We use data on the cost of living to determine how expensive it is to live in Wasco. Real estate prices drive most of the variance in cost of living around California. Key points include:
The cost of living in Wasco is 111 with 100 being average.
The cost of living in Wasco is 1.1x higher than the national average.
The median home value in Wasco is $317,360.
The median income in Wasco is $51,727.
Wasco's Overall Cost Of Living
Higher Than The National Average
Cost Of Living In Wasco Comparison Table
| Living Expense | Wasco | California | National Average |
|---|---|---|---|
| Overall | 111 | 142 | 100 |
| Services | 110 | 110 | 100 |
| Groceries | 117 | 118 | 100 |
| Health | 95 | 197 | 100 |
| Housing | 117 | 120 | 100 |
| Transportation | 119 | 121 | 100 |
| Utilities | 116 | 121 | 100 |
Source: Cost of living index, normalized to US average = 100
Wasco, CA Weather
The average high in Wasco is 75.7° and the average low is 48.6°.
There are 22.3 days of precipitation each year.
Expect an average of 8.4 inches of precipitation each year with 1.7 inches of snow.
| Stat | Wasco |
|---|---|
| Average Annual High | 75.7 |
| Average Annual Low | 48.6 |
| Annual Precipitation Days | 22.3 |
| Average Annual Precipitation | 8.4 |
| Average Annual Snowfall | 1.7 |
Average High
Days of Rain
Source: NOAA climate normals (30-year)
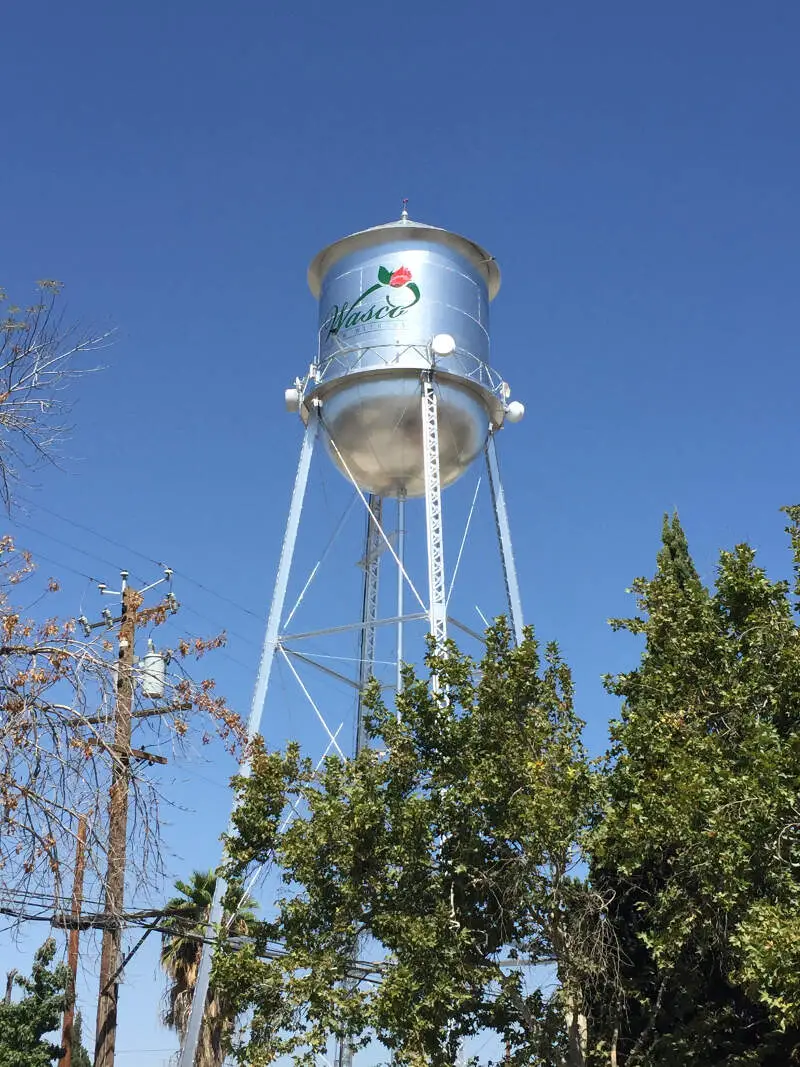
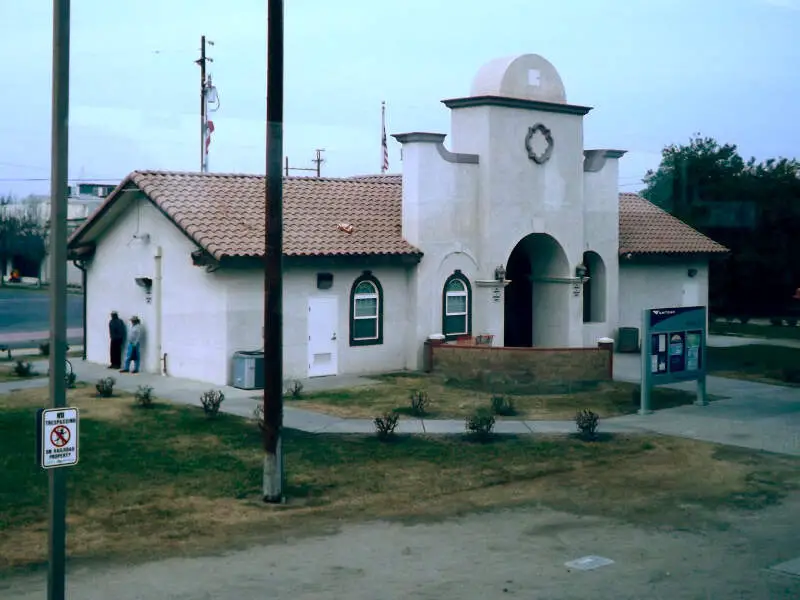
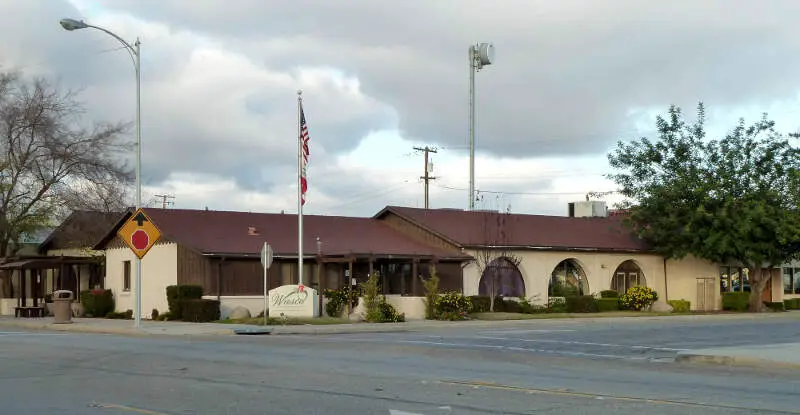
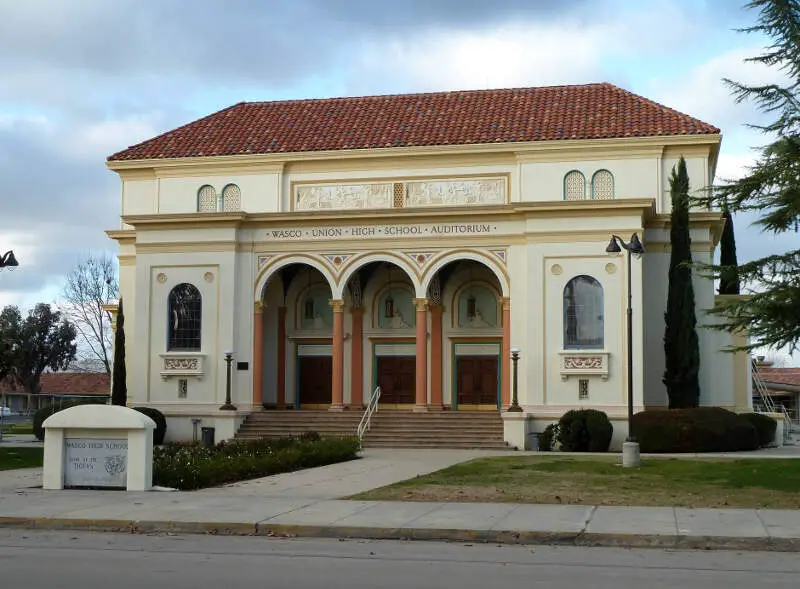
Wasco, CA Photos
1 Reviews & Comments About Wasco

I have lived in wasco for 80 years and though it might not be the best place in the u.s.i seemed to have always made it here.
My dad built a new house here in Wasco in 1928 and it is still there. It never feel down in the 52 earth quake. I have lived in the same house for 56 years and it is paid off. I block from out beautiful high school. Which has one of the nicest auditoriums in all of calif.
Rankings & Articles For Wasco


Locations Around Wasco
Map Of Wasco, CA
Best Places Around Wasco
Greenfield, CA
Population 3,939
Rosedale, CA
Population 18,877
McFarland, CA
Population 14,222
Bakersfield, CA
Population 411,986
Corcoran, CA
Population 22,491
Farmersville, CA
Population 10,397
Tulare, CA
Population 70,945
Earlimart, CA
Population 7,214
Exeter, CA
Population 10,258
Wasco Demographics And Statistics
Population over time in Wasco
The current population in Wasco is 26,558. The population has increased 5.6% from 2010.
| Year | Population | % Change |
|---|---|---|
| 2024 | 26,558 | 1.3% |
| 2023 | 26,222 | -0.4% |
| 2022 | 26,317 | -4.3% |
| 2021 | 27,505 | -0.2% |
| 2020 | 27,553 | 1.3% |
| 2019 | 27,193 | 1.8% |
| 2018 | 26,708 | 1.3% |
| 2017 | 26,378 | 1.2% |
| 2016 | 26,061 | 0.3% |
| 2015 | 25,973 | 0.4% |
| 2014 | 25,865 | 0.7% |
| 2013 | 25,686 | 0.6% |
| 2012 | 25,541 | 0.3% |
| 2011 | 25,457 | 1.2% |
| 2010 | 25,143 | - |
Race / Ethnicity in Wasco
See the full breakdown
Wasco is:
6.7% White with 1,780 White residents.
4.2% African American with 1,111 African American residents.
0.3% American Indian with 82 American Indian residents.
0.5% Asian with 143 Asian residents.
0.0% Hawaiian with 12 Hawaiian residents.
0.2% Other with 41 Other residents.
0.7% Two Or More with 183 Two Or More residents.
87.4% Hispanic with 23,206 Hispanic residents.
| Race | Wasco | CA | USA |
|---|---|---|---|
| White | 6.7% | 33.8% | 57.4% |
| African American | 4.2% | 5.2% | 11.9% |
| American Indian | 0.3% | 0.3% | 0.5% |
| Asian | 0.5% | 15.3% | 5.9% |
| Hawaiian | 0.0% | 0.3% | 0.2% |
| Other | 0.2% | 0.6% | 0.6% |
| Two Or More | 0.7% | 4.4% | 4.3% |
| Hispanic | 87.4% | 40.2% | 19.3% |
Gender in Wasco
See the full breakdown
Wasco is 41.9% female with 11,115 female residents.
Wasco is 58.1% male with 15,442 male residents.
| Gender | Wasco | CA | USA |
|---|---|---|---|
| Female | 41.9% | 50.1% | 50.5% |
| Male | 58.1% | 49.9% | 49.5% |
Highest level of educational attainment in Wasco for adults over 25
See the full breakdown
23.0% of adults in Wasco completed < 9th grade.
14.0% of adults in Wasco completed 9-12th grade.
34.0% of adults in Wasco completed high school / ged.
19.0% of adults in Wasco completed some college.
4.0% of adults in Wasco completed associate's degree.
5.0% of adults in Wasco completed bachelor's degree.
1.0% of adults in Wasco completed master's degree.
0.0% of adults in Wasco completed professional degree.
0.0% of adults in Wasco completed doctorate degree.
| Education | Wasco | CA | USA |
|---|---|---|---|
| < 9th Grade | 23.0% | 8.0% | 4.0% |
| 9-12th Grade | 14.0% | 7.0% | 6.0% |
| High School / GED | 34.0% | 20.0% | 26.0% |
| Some College | 19.0% | 19.0% | 19.0% |
| Associate's Degree | 4.0% | 8.0% | 9.0% |
| Bachelor's Degree | 5.0% | 23.0% | 22.0% |
| Master's Degree | 1.0% | 10.0% | 10.0% |
| Professional Degree | 0.0% | 3.0% | 2.0% |
| Doctorate Degree | 0.0% | 2.0% | 2.0% |
Household Income For Wasco, California
See the full breakdown
4.4% of households in Wasco earn Less than $10,000.
3.3% of households in Wasco earn $10,000 to $14,999.
14.4% of households in Wasco earn $15,000 to $24,999.
9.2% of households in Wasco earn $25,000 to $34,999.
17.7% of households in Wasco earn $35,000 to $49,999.
13.3% of households in Wasco earn $50,000 to $74,999.
12.6% of households in Wasco earn $75,000 to $99,999.
17.2% of households in Wasco earn $100,000 to $149,999.
4.3% of households in Wasco earn $150,000 to $199,999.
3.7% of households in Wasco earn $200,000 or more.
| Income | Wasco | CA | USA |
|---|---|---|---|
| Less than $10,000 | 4.4% | 4.5% | 5.0% |
| $10,000 to $14,999 | 3.3% | 2.9% | 3.4% |
| $15,000 to $24,999 | 14.4% | 5.0% | 6.3% |
| $25,000 to $34,999 | 9.2% | 5.3% | 6.6% |
| $35,000 to $49,999 | 17.7% | 8.1% | 10.1% |
| $50,000 to $74,999 | 13.3% | 13.0% | 15.5% |
| $75,000 to $99,999 | 12.6% | 11.6% | 12.6% |
| $100,000 to $149,999 | 17.2% | 17.8% | 17.5% |
| $150,000 to $199,999 | 4.3% | 11.3% | 9.6% |
| $200,000 or more | 3.7% | 20.5% | 13.4% |
Source: U.S. Census ACS 5-year estimates (2024)


