West Hollywood SnackAbility
Overall SnackAbility
Crime in West Hollywood summary. We use data from the FBI to determine the crime rates in West Hollywood. Key points include:
There were 2,163 total crimes in West Hollywood in the last reporting year.
The overall crime rate per 100,000 people in West Hollywood is 6,375.3 / 100k people.
The violent crime rate per 100,000 people in West Hollywood is 884.2 / 100k people.
The property crime rate per 100,000 people in West Hollywood is 5,491.0 / 100k people.
Overall, crime in West Hollywood is 200.83% above the national average.
Total Crimes
Above National Average
Crime In West Hollywood Comparison Table
| Statistic | Count Raw |
West Hollywood / 100k People |
California / 100k People |
National / 100k People |
|---|---|---|---|---|
| Total Crimes Per 100K | 2,163 | 6,375.3 | 2,564.5 | 2,119.2 |
| Violent Crime | 300 | 884.2 | 486.0 | 359.0 |
| Murder | 2 | 5.9 | 4.5 | 5.0 |
| Robbery | 107 | 315.4 | 119.1 | 61.0 |
| Aggravated Assault | 165 | 486.3 | 325.8 | 256.0 |
| Property Crime | 1,863 | 5,491.0 | 2,078.4 | 1,760.0 |
| Burglary | 290 | 854.8 | 305.8 | 229.0 |
| Larceny | 1,444 | 4,256.1 | 1,345.2 | 1,272.0 |
| Car Theft | 129 | 380.2 | 427.5 | 259.0 |
Source: FBI Uniform Crime Reporting (2024)
Cost of living in West Hollywood summary. We use data on the cost of living to determine how expensive it is to live in West Hollywood. Real estate prices drive most of the variance in cost of living around California. Key points include:
The cost of living in West Hollywood is 182 with 100 being average.
The cost of living in West Hollywood is 1.8x higher than the national average.
The median home value in West Hollywood is $1,019,551.
The median income in West Hollywood is $96,995.
West Hollywood's Overall Cost Of Living
Higher Than The National Average
Cost Of Living In West Hollywood Comparison Table
| Living Expense | West Hollywood | California | National Average |
|---|---|---|---|
| Overall | 182 | 142 | 100 |
| Services | 110 | 110 | 100 |
| Groceries | 117 | 118 | 100 |
| Health | 345 | 197 | 100 |
| Housing | 114 | 120 | 100 |
| Transportation | 121 | 121 | 100 |
| Utilities | 118 | 121 | 100 |
Source: Cost of living index, normalized to US average = 100
West Hollywood, CA Weather
The average high in West Hollywood is 75.3° and the average low is 54.1°.
There are 22.7 days of precipitation each year.
Expect an average of 16.2 inches of precipitation each year with 0.2 inches of snow.
| Stat | West Hollywood |
|---|---|
| Average Annual High | 75.3 |
| Average Annual Low | 54.1 |
| Annual Precipitation Days | 22.7 |
| Average Annual Precipitation | 16.2 |
| Average Annual Snowfall | 0.2 |
Average High
Days of Rain
Source: NOAA climate normals (30-year)
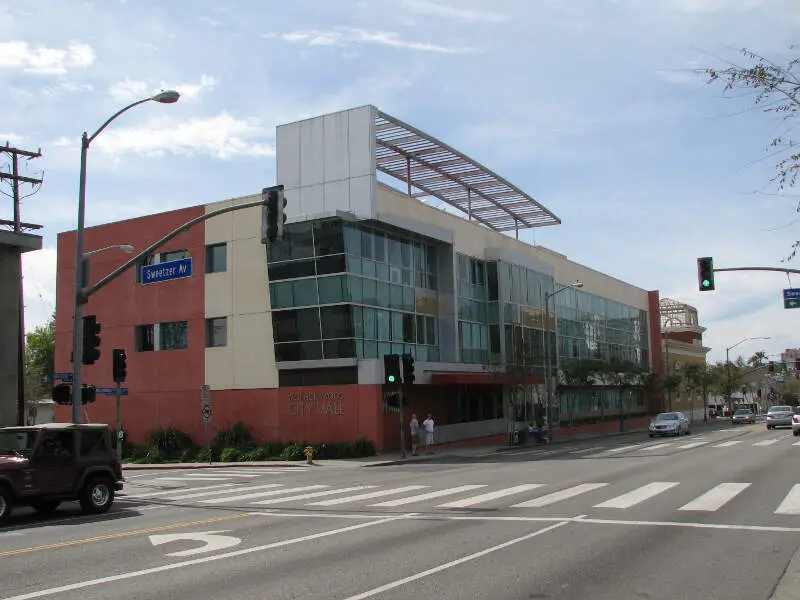
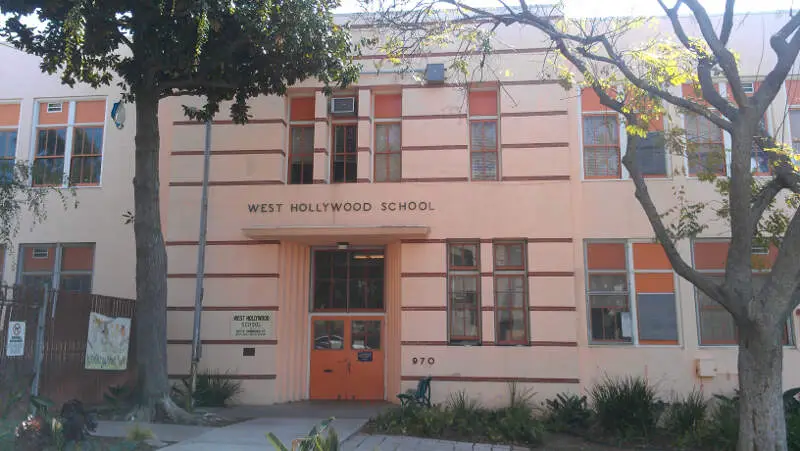
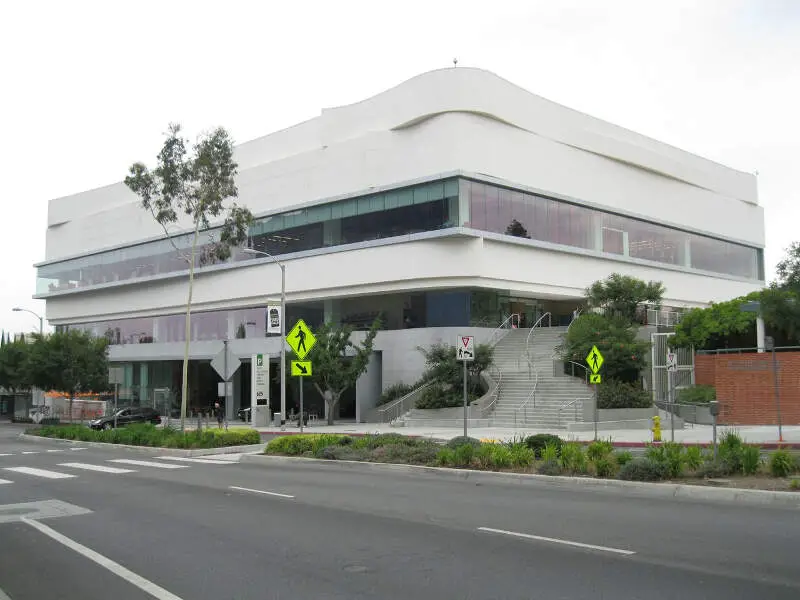
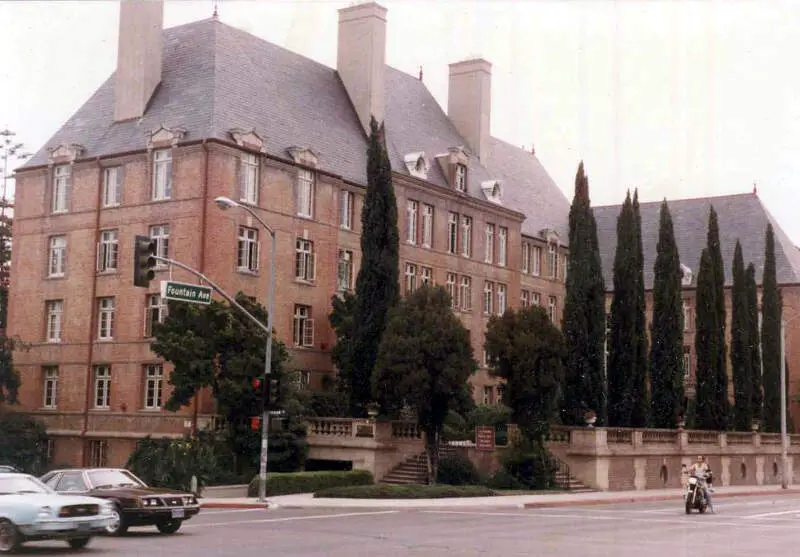
West Hollywood, CA Photos


1 Reviews & Comments About West Hollywood

I went to West Hollywood for just a couple of days. I fell in love immediately. We stayed at a little motel that wasn't the best, but that didn't even matter. We walked around all night and drove around the next day for hours.
My favorite thing to do would just be to sit outside at a restaurant and people watch. I loved the shops. We drove around and looked at the different apartments and houses.
Rankings & Articles For West Hollywood


Locations Around West Hollywood
Map Of West Hollywood, CA
Best Places Around West Hollywood
Del Aire, CA
Population 11,115
San Fernando, CA
Population 23,632
La Crescenta-Montrose, CA
Population 19,660
Torrance, CA
Population 142,130
South Pasadena, CA
Population 26,068
West Whittier-Los Nietos, CA
Population 25,615
Redondo Beach, CA
Population 69,291
Altadena, CA
Population 41,705
Ladera Heights, CA
Population 7,334
West Carson, CA
Population 22,143
West Hollywood Demographics And Statistics
Population over time in West Hollywood
The current population in West Hollywood is 34,884. The population has increased 0.7% from 2010.
| Year | Population | % Change |
|---|---|---|
| 2024 | 34,884 | -0.6% |
| 2023 | 35,090 | -0.8% |
| 2022 | 35,358 | -0.9% |
| 2021 | 35,678 | 0.5% |
| 2020 | 35,506 | -2.6% |
| 2019 | 36,450 | 0.2% |
| 2018 | 36,384 | 0.7% |
| 2017 | 36,148 | 1.4% |
| 2016 | 35,661 | 0.9% |
| 2015 | 35,332 | 0.8% |
| 2014 | 35,053 | 1.0% |
| 2013 | 34,709 | 0.4% |
| 2012 | 34,572 | 0.0% |
| 2011 | 34,564 | -0.3% |
| 2010 | 34,657 | - |
Race / Ethnicity in West Hollywood
See the full breakdown
West Hollywood is:
69.5% White with 24,236 White residents.
4.3% African American with 1,516 African American residents.
0.1% American Indian with 35 American Indian residents.
6.1% Asian with 2,111 Asian residents.
0.0% Hawaiian with 0 Hawaiian residents.
1.3% Other with 446 Other residents.
5.6% Two Or More with 1,962 Two Or More residents.
13.1% Hispanic with 4,578 Hispanic residents.
| Race | West Hollywood | CA | USA |
|---|---|---|---|
| White | 69.5% | 33.8% | 57.4% |
| African American | 4.3% | 5.2% | 11.9% |
| American Indian | 0.1% | 0.3% | 0.5% |
| Asian | 6.1% | 15.3% | 5.9% |
| Hawaiian | 0.0% | 0.3% | 0.2% |
| Other | 1.3% | 0.6% | 0.6% |
| Two Or More | 5.6% | 4.4% | 4.3% |
| Hispanic | 13.1% | 40.2% | 19.3% |
Gender in West Hollywood
See the full breakdown
West Hollywood is 43.9% female with 15,319 female residents.
West Hollywood is 56.1% male with 19,565 male residents.
| Gender | West Hollywood | CA | USA |
|---|---|---|---|
| Female | 43.9% | 50.1% | 50.5% |
| Male | 56.1% | 49.9% | 49.5% |
Highest level of educational attainment in West Hollywood for adults over 25
See the full breakdown
4.0% of adults in West Hollywood completed < 9th grade.
1.0% of adults in West Hollywood completed 9-12th grade.
9.0% of adults in West Hollywood completed high school / ged.
14.0% of adults in West Hollywood completed some college.
8.0% of adults in West Hollywood completed associate's degree.
42.0% of adults in West Hollywood completed bachelor's degree.
15.0% of adults in West Hollywood completed master's degree.
5.0% of adults in West Hollywood completed professional degree.
2.0% of adults in West Hollywood completed doctorate degree.
| Education | West Hollywood | CA | USA |
|---|---|---|---|
| < 9th Grade | 4.0% | 8.0% | 4.0% |
| 9-12th Grade | 1.0% | 7.0% | 6.0% |
| High School / GED | 9.0% | 20.0% | 26.0% |
| Some College | 14.0% | 19.0% | 19.0% |
| Associate's Degree | 8.0% | 8.0% | 9.0% |
| Bachelor's Degree | 42.0% | 23.0% | 22.0% |
| Master's Degree | 15.0% | 10.0% | 10.0% |
| Professional Degree | 5.0% | 3.0% | 2.0% |
| Doctorate Degree | 2.0% | 2.0% | 2.0% |
Household Income For West Hollywood, California
See the full breakdown
6.0% of households in West Hollywood earn Less than $10,000.
4.4% of households in West Hollywood earn $10,000 to $14,999.
6.2% of households in West Hollywood earn $15,000 to $24,999.
5.6% of households in West Hollywood earn $25,000 to $34,999.
8.2% of households in West Hollywood earn $35,000 to $49,999.
9.6% of households in West Hollywood earn $50,000 to $74,999.
11.5% of households in West Hollywood earn $75,000 to $99,999.
19.7% of households in West Hollywood earn $100,000 to $149,999.
8.3% of households in West Hollywood earn $150,000 to $199,999.
20.5% of households in West Hollywood earn $200,000 or more.
| Income | West Hollywood | CA | USA |
|---|---|---|---|
| Less than $10,000 | 6.0% | 4.5% | 5.0% |
| $10,000 to $14,999 | 4.4% | 2.9% | 3.4% |
| $15,000 to $24,999 | 6.2% | 5.0% | 6.3% |
| $25,000 to $34,999 | 5.6% | 5.3% | 6.6% |
| $35,000 to $49,999 | 8.2% | 8.1% | 10.1% |
| $50,000 to $74,999 | 9.6% | 13.0% | 15.5% |
| $75,000 to $99,999 | 11.5% | 11.6% | 12.6% |
| $100,000 to $149,999 | 19.7% | 17.8% | 17.5% |
| $150,000 to $199,999 | 8.3% | 11.3% | 9.6% |
| $200,000 or more | 20.5% | 20.5% | 13.4% |
Source: U.S. Census ACS 5-year estimates (2024)


