Derby SnackAbility
Overall SnackAbility
Crime in Derby summary. We use data from the FBI to determine the crime rates in Derby. Key points include:
There were 356 total crimes in Derby in the last reporting year.
The overall crime rate per 100,000 people in Derby is 2,862.4 / 100k people.
The violent crime rate per 100,000 people in Derby is 313.6 / 100k people.
The property crime rate per 100,000 people in Derby is 2,548.8 / 100k people.
Overall, crime in Derby is 35.07% above the national average.
Total Crimes
Above National Average
Crime In Derby Comparison Table
| Statistic | Count Raw |
Derby / 100k People |
Connecticut / 100k People |
National / 100k People |
|---|---|---|---|---|
| Total Crimes Per 100K | 356 | 2,862.4 | 1,502.1 | 2,119.2 |
| Violent Crime | 39 | 313.6 | 136.0 | 359.0 |
| Murder | 0 | 0.0 | 2.4 | 5.0 |
| Robbery | 6 | 48.2 | 38.1 | 61.0 |
| Aggravated Assault | 32 | 257.3 | 77.5 | 256.0 |
| Property Crime | 317 | 2,548.8 | 1,366.1 | 1,760.0 |
| Burglary | 35 | 281.4 | 117.3 | 229.0 |
| Larceny | 189 | 1,519.7 | 1,013.7 | 1,272.0 |
| Car Theft | 93 | 747.8 | 235.0 | 259.0 |
Source: FBI Uniform Crime Reporting (2024)
Cost of living in Derby summary. We use data on the cost of living to determine how expensive it is to live in Derby. Real estate prices drive most of the variance in cost of living around Connecticut. Key points include:
The cost of living in Derby is 111 with 100 being average.
The cost of living in Derby is 1.1x higher than the national average.
The median home value in Derby is $336,764.
The median income in Derby is $79,500.
Derby's Overall Cost Of Living
Higher Than The National Average
Cost Of Living In Derby Comparison Table
| Living Expense | Derby | Connecticut | National Average |
|---|---|---|---|
| Overall | 111 | 116 | 100 |
| Services | 102 | 107 | 100 |
| Groceries | 108 | 111 | 100 |
| Health | 111 | 137 | 100 |
| Housing | 110 | 108 | 100 |
| Transportation | 109 | 110 | 100 |
| Utilities | 108 | 111 | 100 |
Source: Cost of living index, normalized to US average = 100
Derby, CT Weather
The average high in Derby is 60.5° and the average low is 41.1°.
There are 77.6 days of precipitation each year.
Expect an average of 49.9 inches of precipitation each year with 34.0 inches of snow.
| Stat | Derby |
|---|---|
| Average Annual High | 60.5 |
| Average Annual Low | 41.1 |
| Annual Precipitation Days | 77.6 |
| Average Annual Precipitation | 49.9 |
| Average Annual Snowfall | 34.0 |
Average High
Days of Rain
Source: NOAA climate normals (30-year)
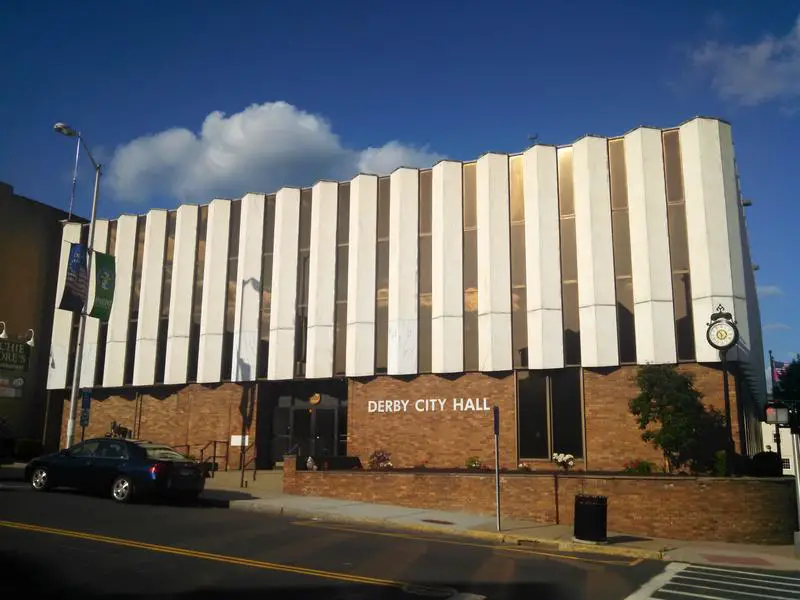
Derby, CT Photos
2 Reviews & Comments About Derby

WOW!!! I used to live in CT. I lived in New Haven, Derby & Bridgeport and I used to stay in Hartford & Waterbury from time to time.
I lived in Derby for 8 years and I lived in New Haven for 22 years. I left New Haven & actually moved to Derby to move to a smaller town wmurders, shootings, drugs, etc. Derby was like 'Andy Griffith' town so to speak. It was very small. No malls, small population, If you cross the threshold you could either be in Ansonia or Shelton because it was just that small. Truth spoken about no job availability was accurate for Derby. Buses ran every hour and last bus was at 8:30p.m.
The rents are cheaper in Derby & Waterbury because the towns are smaller but you have to travel a little distance for a job.
Now what I will say is CT is the richest state. The pay rate is higher, the cost of living is high as well.
I live in Derby. Derby is a nice city. There is barley any crimes here. The neighborhood I live in is quiet. The bad part of Derby in my opinion is Hawkins and Anson Street.
Rankings & Articles For Derby


Locations Around Derby
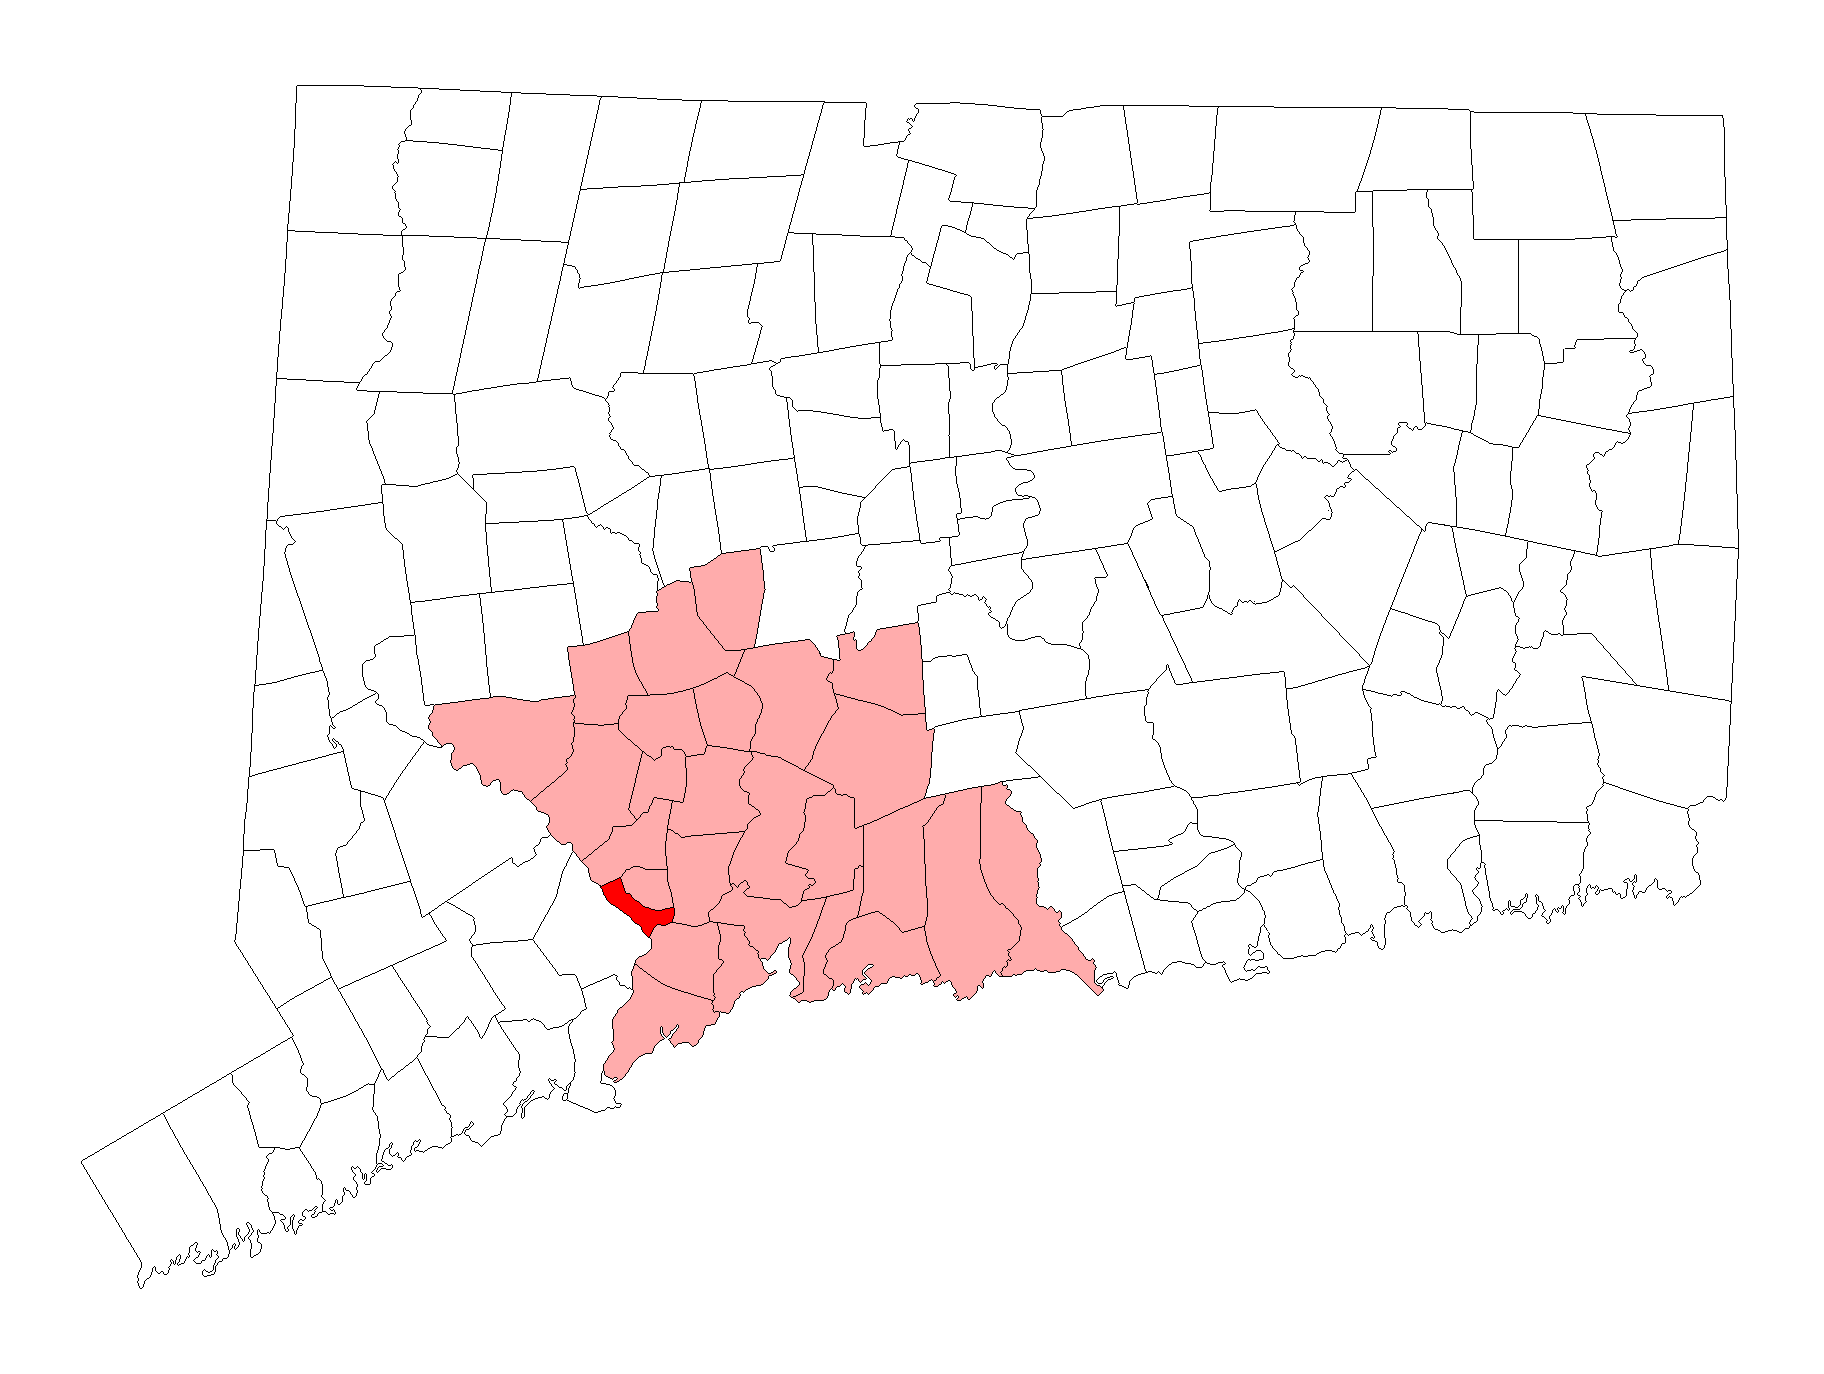
Map Of Derby, CT
Best Places Around Derby
Orange, CT
Population 14,315
Oakville, CT
Population 9,276
North Haven, CT
Population 24,336
Bethel, CT
Population 11,404
Milford, CT
Population 51,023
Shelton, CT
Population 41,889
Derby Demographics And Statistics
Population over time in Derby
The current population in Derby is 12,487. The population has decreased 2.6% from 2010.
| Year | Population | % Change |
|---|---|---|
| 2024 | 12,487 | 1.0% |
| 2023 | 12,359 | -0.1% |
| 2022 | 12,373 | -0.1% |
| 2021 | 12,387 | -0.3% |
| 2020 | 12,420 | -0.5% |
| 2019 | 12,485 | -0.9% |
| 2018 | 12,596 | -0.8% |
| 2017 | 12,700 | -0.4% |
| 2016 | 12,755 | -0.3% |
| 2015 | 12,796 | -0.3% |
| 2014 | 12,837 | -0.0% |
| 2013 | 12,841 | -0.1% |
| 2012 | 12,858 | 0.1% |
| 2011 | 12,845 | 0.1% |
| 2010 | 12,826 | - |
Race / Ethnicity in Derby
See the full breakdown
Derby is:
57.6% White with 7,193 White residents.
11.3% African American with 1,412 African American residents.
0.1% American Indian with 14 American Indian residents.
2.5% Asian with 313 Asian residents.
0.0% Hawaiian with 0 Hawaiian residents.
2.0% Other with 247 Other residents.
4.1% Two Or More with 514 Two Or More residents.
22.4% Hispanic with 2,794 Hispanic residents.
| Race | Derby | CT | USA |
|---|---|---|---|
| White | 57.6% | 61.9% | 57.4% |
| African American | 11.3% | 9.8% | 11.9% |
| American Indian | 0.1% | 0.1% | 0.5% |
| Asian | 2.5% | 4.7% | 5.9% |
| Hawaiian | 0.0% | 0.0% | 0.2% |
| Other | 2.0% | 0.9% | 0.6% |
| Two Or More | 4.1% | 4.3% | 4.3% |
| Hispanic | 22.4% | 18.3% | 19.3% |
Gender in Derby
See the full breakdown
Derby is 51.7% female with 6,451 female residents.
Derby is 48.3% male with 6,036 male residents.
| Gender | Derby | CT | USA |
|---|---|---|---|
| Female | 51.7% | 50.9% | 50.5% |
| Male | 48.3% | 49.1% | 49.5% |
Highest level of educational attainment in Derby for adults over 25
See the full breakdown
4.0% of adults in Derby completed < 9th grade.
8.0% of adults in Derby completed 9-12th grade.
30.0% of adults in Derby completed high school / ged.
15.0% of adults in Derby completed some college.
7.0% of adults in Derby completed associate's degree.
20.0% of adults in Derby completed bachelor's degree.
12.0% of adults in Derby completed master's degree.
1.0% of adults in Derby completed professional degree.
3.0% of adults in Derby completed doctorate degree.
| Education | Derby | CT | USA |
|---|---|---|---|
| < 9th Grade | 4.0% | 5.0% | 4.0% |
| 9-12th Grade | 8.0% | 4.0% | 6.0% |
| High School / GED | 30.0% | 25.0% | 26.0% |
| Some College | 15.0% | 16.0% | 19.0% |
| Associate's Degree | 7.0% | 8.0% | 9.0% |
| Bachelor's Degree | 20.0% | 23.0% | 22.0% |
| Master's Degree | 12.0% | 14.0% | 10.0% |
| Professional Degree | 1.0% | 3.0% | 2.0% |
| Doctorate Degree | 3.0% | 2.0% | 2.0% |
Household Income For Derby, Connecticut
See the full breakdown
6.3% of households in Derby earn Less than $10,000.
6.0% of households in Derby earn $10,000 to $14,999.
5.6% of households in Derby earn $15,000 to $24,999.
5.4% of households in Derby earn $25,000 to $34,999.
12.4% of households in Derby earn $35,000 to $49,999.
10.4% of households in Derby earn $50,000 to $74,999.
13.5% of households in Derby earn $75,000 to $99,999.
23.5% of households in Derby earn $100,000 to $149,999.
9.1% of households in Derby earn $150,000 to $199,999.
7.8% of households in Derby earn $200,000 or more.
| Income | Derby | CT | USA |
|---|---|---|---|
| Less than $10,000 | 6.3% | 4.5% | 5.0% |
| $10,000 to $14,999 | 6.0% | 3.1% | 3.4% |
| $15,000 to $24,999 | 5.6% | 5.3% | 6.3% |
| $25,000 to $34,999 | 5.4% | 5.3% | 6.6% |
| $35,000 to $49,999 | 12.4% | 8.4% | 10.1% |
| $50,000 to $74,999 | 10.4% | 13.3% | 15.5% |
| $75,000 to $99,999 | 13.5% | 11.9% | 12.6% |
| $100,000 to $149,999 | 23.5% | 17.7% | 17.5% |
| $150,000 to $199,999 | 9.1% | 11.3% | 9.6% |
| $200,000 or more | 7.8% | 19.2% | 13.4% |
Source: U.S. Census ACS 5-year estimates (2024)


