Hartford SnackAbility
Overall SnackAbility
Crime in Hartford summary. We use data from the FBI to determine the crime rates in Hartford. Key points include:
There were 4,021 total crimes in Hartford in the last reporting year.
The overall crime rate per 100,000 people in Hartford is 3,361.3 / 100k people.
The violent crime rate per 100,000 people in Hartford is 515.8 / 100k people.
The property crime rate per 100,000 people in Hartford is 2,845.5 / 100k people.
Overall, crime in Hartford is 58.61% above the national average.
Total Crimes
Above National Average
Crime In Hartford Comparison Table
| Statistic | Count Raw |
Hartford / 100k People |
Connecticut / 100k People |
National / 100k People |
|---|---|---|---|---|
| Total Crimes Per 100K | 4,021 | 3,361.3 | 1,502.1 | 2,119.2 |
| Violent Crime | 617 | 515.8 | 136.0 | 359.0 |
| Murder | 21 | 17.6 | 2.4 | 5.0 |
| Robbery | 163 | 136.3 | 38.1 | 61.0 |
| Aggravated Assault | 382 | 319.3 | 77.5 | 256.0 |
| Property Crime | 3,404 | 2,845.5 | 1,366.1 | 1,760.0 |
| Burglary | 267 | 223.2 | 117.3 | 229.0 |
| Larceny | 2,082 | 1,740.4 | 1,013.7 | 1,272.0 |
| Car Theft | 1,055 | 881.9 | 235.0 | 259.0 |
Source: FBI Uniform Crime Reporting (2024)
Cost of living in Hartford summary. We use data on the cost of living to determine how expensive it is to live in Hartford. Real estate prices drive most of the variance in cost of living around Connecticut. Key points include:
The cost of living in Hartford is 104 with 100 being average.
The cost of living in Hartford is 1.0x higher than the national average.
The median home value in Hartford is $198,964.
The median income in Hartford is $46,411.
Hartford's Overall Cost Of Living
Higher Than The National Average
Cost Of Living In Hartford Comparison Table
| Living Expense | Hartford | Connecticut | National Average |
|---|---|---|---|
| Overall | 104 | 116 | 100 |
| Services | 105 | 107 | 100 |
| Groceries | 112 | 111 | 100 |
| Health | 98 | 137 | 100 |
| Housing | 112 | 108 | 100 |
| Transportation | 110 | 110 | 100 |
| Utilities | 113 | 111 | 100 |
Source: Cost of living index, normalized to US average = 100
Hartford, CT Weather
The average high in Hartford is 60.1° and the average low is 39.7°.
There are 76.8 days of precipitation each year.
Expect an average of 47.8 inches of precipitation each year with 39.3 inches of snow.
| Stat | Hartford |
|---|---|
| Average Annual High | 60.1 |
| Average Annual Low | 39.7 |
| Annual Precipitation Days | 76.8 |
| Average Annual Precipitation | 47.8 |
| Average Annual Snowfall | 39.3 |
Average High
Days of Rain
Source: NOAA climate normals (30-year)
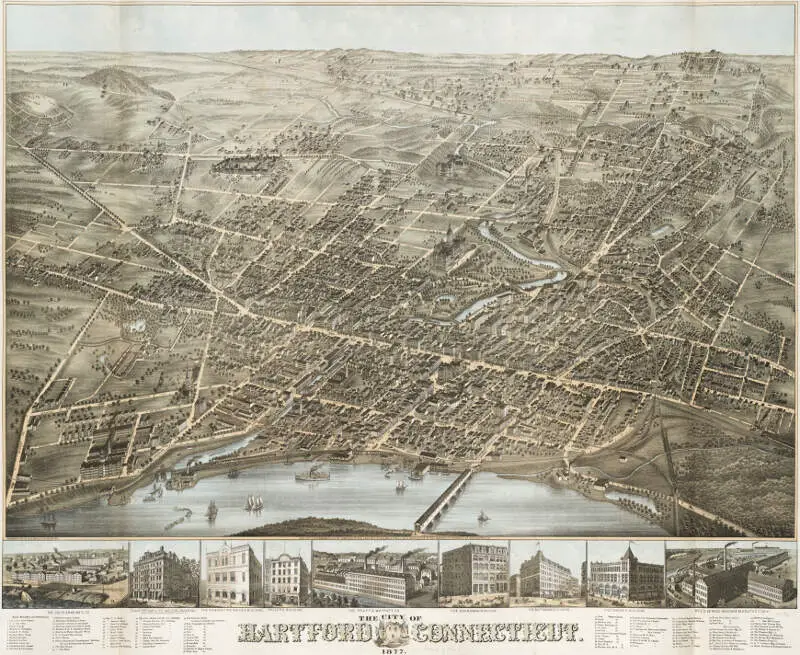
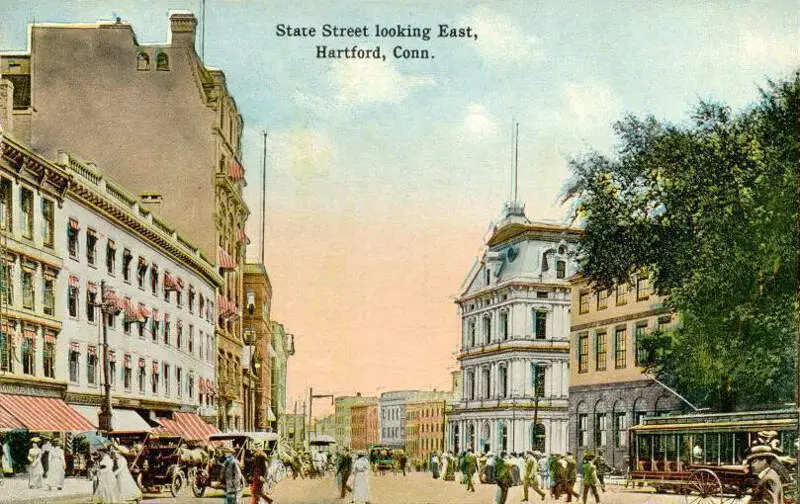
Hartford, CT Photos


1 Reviews & Comments About Hartford

Hartford is a miserable crime riddled city without any positive attributes. The restaurants are sub-par. The crime rate is through the roof. It is not uncommon to see prostitutes and pimps. You can't drive more than a couple blocks before you see a drug deal. The mayor is an idiot and is doing nothing to turn his awful city around. Now, the City of Hartford thinks the State of Connecticut should bail them out.
There is nothing worthwhile in this city. The baseball team is a complete joke. The restaurants are sub-par. The parks are heroine needle filled. The roads are full of potholes. The hospitals frequently treat people with gun shot wounds and stabbings. Avoid Hartford, Connecticut at all costs.
Rankings & Articles For Hartford


Locations Around Hartford
Map Of Hartford, CT
Best Places Around Hartford
Kensington, CT
Population 9,962
West Hartford, CT
Population 63,620
Sherwood Manor, CT
Population 5,706
Wethersfield, CT
Population 27,250
Southwood Acres, CT
Population 8,115
Newington, CT
Population 30,896
Windsor Locks, CT
Population 12,579
Hartford Demographics And Statistics
Population over time in Hartford
The current population in Hartford is 121,127. The population has decreased 2.9% from 2010.
| Year | Population | % Change |
|---|---|---|
| 2024 | 121,127 | 1.0% |
| 2023 | 119,970 | -0.9% |
| 2022 | 121,057 | -0.4% |
| 2021 | 121,562 | -0.8% |
| 2020 | 122,549 | -0.4% |
| 2019 | 123,088 | -0.4% |
| 2018 | 123,628 | -0.6% |
| 2017 | 124,390 | 0.1% |
| 2016 | 124,320 | -0.4% |
| 2015 | 124,795 | -0.3% |
| 2014 | 125,211 | 0.1% |
| 2013 | 125,130 | 0.2% |
| 2012 | 124,879 | 0.0% |
| 2011 | 124,817 | 0.0% |
| 2010 | 124,760 | - |
Race / Ethnicity in Hartford
See the full breakdown
Hartford is:
15.1% White with 18,272 White residents.
33.8% African American with 40,955 African American residents.
0.1% American Indian with 102 American Indian residents.
2.4% Asian with 2,904 Asian residents.
0.1% Hawaiian with 89 Hawaiian residents.
0.8% Other with 1,019 Other residents.
3.2% Two Or More with 3,845 Two Or More residents.
44.5% Hispanic with 53,941 Hispanic residents.
| Race | Hartford | CT | USA |
|---|---|---|---|
| White | 15.1% | 61.9% | 57.4% |
| African American | 33.8% | 9.8% | 11.9% |
| American Indian | 0.1% | 0.1% | 0.5% |
| Asian | 2.4% | 4.7% | 5.9% |
| Hawaiian | 0.1% | 0.0% | 0.2% |
| Other | 0.8% | 0.9% | 0.6% |
| Two Or More | 3.2% | 4.3% | 4.3% |
| Hispanic | 44.5% | 18.3% | 19.3% |
Gender in Hartford
See the full breakdown
Hartford is 52.2% female with 63,219 female residents.
Hartford is 47.8% male with 57,908 male residents.
| Gender | Hartford | CT | USA |
|---|---|---|---|
| Female | 52.2% | 50.9% | 50.5% |
| Male | 47.8% | 49.1% | 49.5% |
Highest level of educational attainment in Hartford for adults over 25
See the full breakdown
12.0% of adults in Hartford completed < 9th grade.
13.0% of adults in Hartford completed 9-12th grade.
33.0% of adults in Hartford completed high school / ged.
17.0% of adults in Hartford completed some college.
6.0% of adults in Hartford completed associate's degree.
11.0% of adults in Hartford completed bachelor's degree.
6.0% of adults in Hartford completed master's degree.
1.0% of adults in Hartford completed professional degree.
1.0% of adults in Hartford completed doctorate degree.
| Education | Hartford | CT | USA |
|---|---|---|---|
| < 9th Grade | 12.0% | 5.0% | 4.0% |
| 9-12th Grade | 13.0% | 4.0% | 6.0% |
| High School / GED | 33.0% | 25.0% | 26.0% |
| Some College | 17.0% | 16.0% | 19.0% |
| Associate's Degree | 6.0% | 8.0% | 9.0% |
| Bachelor's Degree | 11.0% | 23.0% | 22.0% |
| Master's Degree | 6.0% | 14.0% | 10.0% |
| Professional Degree | 1.0% | 3.0% | 2.0% |
| Doctorate Degree | 1.0% | 2.0% | 2.0% |
Household Income For Hartford, Connecticut
See the full breakdown
10.9% of households in Hartford earn Less than $10,000.
9.3% of households in Hartford earn $10,000 to $14,999.
9.6% of households in Hartford earn $15,000 to $24,999.
9.6% of households in Hartford earn $25,000 to $34,999.
13.4% of households in Hartford earn $35,000 to $49,999.
17.4% of households in Hartford earn $50,000 to $74,999.
10.8% of households in Hartford earn $75,000 to $99,999.
9.6% of households in Hartford earn $100,000 to $149,999.
4.5% of households in Hartford earn $150,000 to $199,999.
4.9% of households in Hartford earn $200,000 or more.
| Income | Hartford | CT | USA |
|---|---|---|---|
| Less than $10,000 | 10.9% | 4.5% | 5.0% |
| $10,000 to $14,999 | 9.3% | 3.1% | 3.4% |
| $15,000 to $24,999 | 9.6% | 5.3% | 6.3% |
| $25,000 to $34,999 | 9.6% | 5.3% | 6.6% |
| $35,000 to $49,999 | 13.4% | 8.4% | 10.1% |
| $50,000 to $74,999 | 17.4% | 13.3% | 15.5% |
| $75,000 to $99,999 | 10.8% | 11.9% | 12.6% |
| $100,000 to $149,999 | 9.6% | 17.7% | 17.5% |
| $150,000 to $199,999 | 4.5% | 11.3% | 9.6% |
| $200,000 or more | 4.9% | 19.2% | 13.4% |
Source: U.S. Census ACS 5-year estimates (2024)


