New Britain SnackAbility
Overall SnackAbility
Crime in New Britain summary. We use data from the FBI to determine the crime rates in New Britain. Key points include:
There were 1,749 total crimes in New Britain in the last reporting year.
The overall crime rate per 100,000 people in New Britain is 2,346.8 / 100k people.
The violent crime rate per 100,000 people in New Britain is 421.3 / 100k people.
The property crime rate per 100,000 people in New Britain is 1,925.5 / 100k people.
Overall, crime in New Britain is 10.74% above the national average.
Total Crimes
Above National Average
Crime In New Britain Comparison Table
| Statistic | Count Raw |
New Britain / 100k People |
Connecticut / 100k People |
National / 100k People |
|---|---|---|---|---|
| Total Crimes Per 100K | 1,749 | 2,346.8 | 1,502.1 | 2,119.2 |
| Violent Crime | 314 | 421.3 | 136.0 | 359.0 |
| Murder | 3 | 4.0 | 2.4 | 5.0 |
| Robbery | 49 | 65.7 | 38.1 | 61.0 |
| Aggravated Assault | 228 | 305.9 | 77.5 | 256.0 |
| Property Crime | 1,435 | 1,925.5 | 1,366.1 | 1,760.0 |
| Burglary | 97 | 130.2 | 117.3 | 229.0 |
| Larceny | 975 | 1,308.2 | 1,013.7 | 1,272.0 |
| Car Theft | 363 | 487.1 | 235.0 | 259.0 |
Source: FBI Uniform Crime Reporting (2024)
Cost of living in New Britain summary. We use data on the cost of living to determine how expensive it is to live in New Britain. Real estate prices drive most of the variance in cost of living around Connecticut. Key points include:
The cost of living in New Britain is 104 with 100 being average.
The cost of living in New Britain is 1.0x higher than the national average.
The median home value in New Britain is $298,511.
The median income in New Britain is $58,613.
New Britain's Overall Cost Of Living
Higher Than The National Average
Cost Of Living In New Britain Comparison Table
| Living Expense | New Britain | Connecticut | National Average |
|---|---|---|---|
| Overall | 104 | 116 | 100 |
| Services | 106 | 107 | 100 |
| Groceries | 112 | 111 | 100 |
| Health | 94 | 137 | 100 |
| Housing | 107 | 108 | 100 |
| Transportation | 106 | 110 | 100 |
| Utilities | 106 | 111 | 100 |
Source: Cost of living index, normalized to US average = 100
New Britain, CT Weather
The average high in New Britain is 60.1° and the average low is 39.7°.
There are 76.8 days of precipitation each year.
Expect an average of 47.8 inches of precipitation each year with 39.3 inches of snow.
| Stat | New Britain |
|---|---|
| Average Annual High | 60.1 |
| Average Annual Low | 39.7 |
| Annual Precipitation Days | 76.8 |
| Average Annual Precipitation | 47.8 |
| Average Annual Snowfall | 39.3 |
Average High
Days of Rain
Source: NOAA climate normals (30-year)
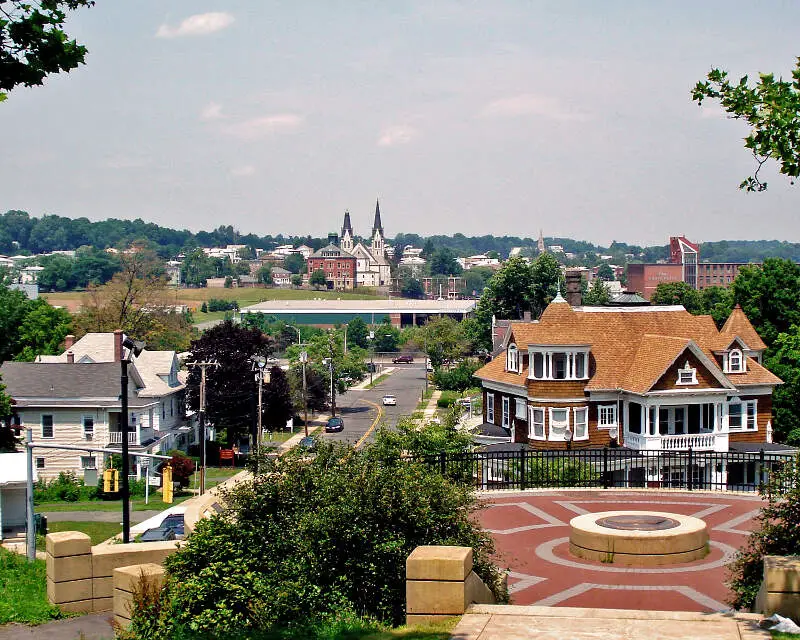
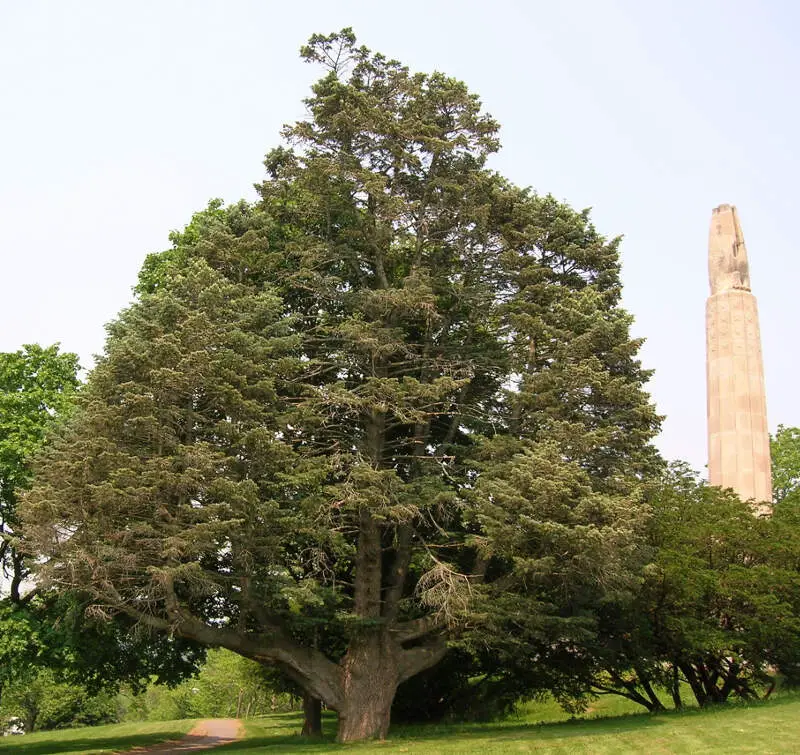
New Britain, CT Photos
2 Reviews & Comments About New Britain

I live in New Britain and I never went to the high school or middle school so I went to a magnet school in Hartford. New Britain has high taxes really high taxes.
I live in new Britain it ain't that bad here wtf !,!,
Rankings & Articles For New Britain


Locations Around New Britain
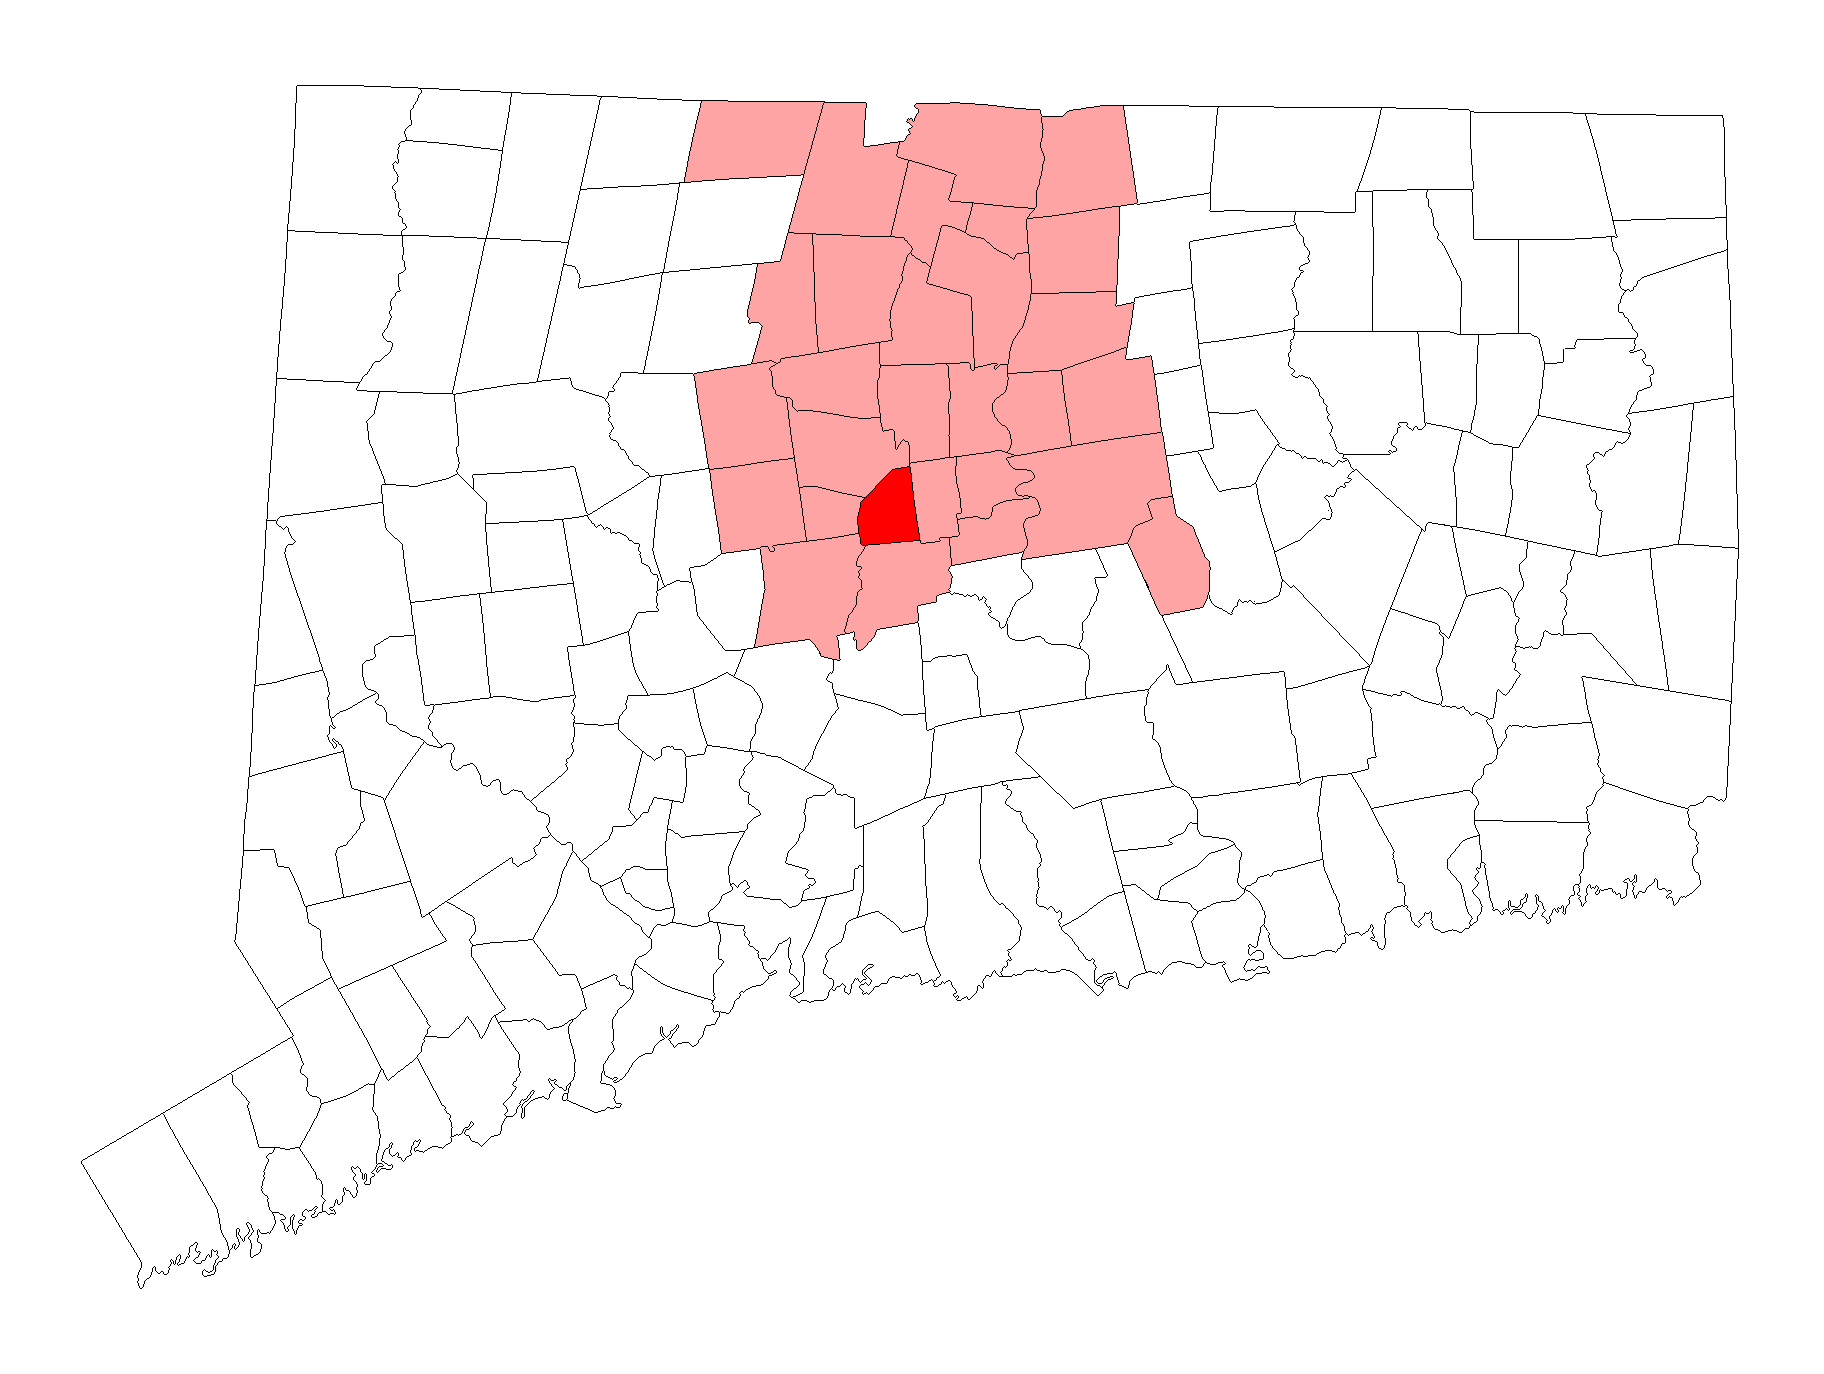
Map Of New Britain, CT
Best Places Around New Britain
Oakville, CT
Population 9,276
Kensington, CT
Population 9,962
West Hartford, CT
Population 63,620
Wethersfield, CT
Population 27,250
Newington, CT
Population 30,896
Windsor Locks, CT
Population 12,579
New Britain Demographics And Statistics
Population over time in New Britain
The current population in New Britain is 74,223. The population has increased 1.7% from 2010.
| Year | Population | % Change |
|---|---|---|
| 2024 | 74,223 | 1.3% |
| 2023 | 73,301 | -1.2% |
| 2022 | 74,212 | 0.3% |
| 2021 | 74,022 | 2.0% |
| 2020 | 72,543 | -0.3% |
| 2019 | 72,767 | -0.1% |
| 2018 | 72,839 | -0.3% |
| 2017 | 73,069 | 0.3% |
| 2016 | 72,876 | -0.2% |
| 2015 | 72,988 | -0.1% |
| 2014 | 73,095 | -0.0% |
| 2013 | 73,112 | -0.0% |
| 2012 | 73,122 | 0.1% |
| 2011 | 73,055 | 0.1% |
| 2010 | 72,954 | - |
Race / Ethnicity in New Britain
See the full breakdown
New Britain is:
40.3% White with 29,922 White residents.
10.3% African American with 7,640 African American residents.
0.1% American Indian with 64 American Indian residents.
2.4% Asian with 1,759 Asian residents.
0.0% Hawaiian with 10 Hawaiian residents.
0.3% Other with 233 Other residents.
4.8% Two Or More with 3,561 Two Or More residents.
41.8% Hispanic with 31,034 Hispanic residents.
| Race | New Britain | CT | USA |
|---|---|---|---|
| White | 40.3% | 61.9% | 57.4% |
| African American | 10.3% | 9.8% | 11.9% |
| American Indian | 0.1% | 0.1% | 0.5% |
| Asian | 2.4% | 4.7% | 5.9% |
| Hawaiian | 0.0% | 0.0% | 0.2% |
| Other | 0.3% | 0.9% | 0.6% |
| Two Or More | 4.8% | 4.3% | 4.3% |
| Hispanic | 41.8% | 18.3% | 19.3% |
Gender in New Britain
See the full breakdown
New Britain is 51.8% female with 38,438 female residents.
New Britain is 48.2% male with 35,784 male residents.
| Gender | New Britain | CT | USA |
|---|---|---|---|
| Female | 51.8% | 50.9% | 50.5% |
| Male | 48.2% | 49.1% | 49.5% |
Highest level of educational attainment in New Britain for adults over 25
See the full breakdown
7.0% of adults in New Britain completed < 9th grade.
9.0% of adults in New Britain completed 9-12th grade.
37.0% of adults in New Britain completed high school / ged.
19.0% of adults in New Britain completed some college.
8.0% of adults in New Britain completed associate's degree.
12.0% of adults in New Britain completed bachelor's degree.
6.0% of adults in New Britain completed master's degree.
1.0% of adults in New Britain completed professional degree.
1.0% of adults in New Britain completed doctorate degree.
| Education | New Britain | CT | USA |
|---|---|---|---|
| < 9th Grade | 7.0% | 5.0% | 4.0% |
| 9-12th Grade | 9.0% | 4.0% | 6.0% |
| High School / GED | 37.0% | 25.0% | 26.0% |
| Some College | 19.0% | 16.0% | 19.0% |
| Associate's Degree | 8.0% | 8.0% | 9.0% |
| Bachelor's Degree | 12.0% | 23.0% | 22.0% |
| Master's Degree | 6.0% | 14.0% | 10.0% |
| Professional Degree | 1.0% | 3.0% | 2.0% |
| Doctorate Degree | 1.0% | 2.0% | 2.0% |
Household Income For New Britain, Connecticut
See the full breakdown
6.9% of households in New Britain earn Less than $10,000.
5.3% of households in New Britain earn $10,000 to $14,999.
9.6% of households in New Britain earn $15,000 to $24,999.
8.7% of households in New Britain earn $25,000 to $34,999.
13.0% of households in New Britain earn $35,000 to $49,999.
15.5% of households in New Britain earn $50,000 to $74,999.
13.7% of households in New Britain earn $75,000 to $99,999.
15.2% of households in New Britain earn $100,000 to $149,999.
6.4% of households in New Britain earn $150,000 to $199,999.
5.6% of households in New Britain earn $200,000 or more.
| Income | New Britain | CT | USA |
|---|---|---|---|
| Less than $10,000 | 6.9% | 4.5% | 5.0% |
| $10,000 to $14,999 | 5.3% | 3.1% | 3.4% |
| $15,000 to $24,999 | 9.6% | 5.3% | 6.3% |
| $25,000 to $34,999 | 8.7% | 5.3% | 6.6% |
| $35,000 to $49,999 | 13.0% | 8.4% | 10.1% |
| $50,000 to $74,999 | 15.5% | 13.3% | 15.5% |
| $75,000 to $99,999 | 13.7% | 11.9% | 12.6% |
| $100,000 to $149,999 | 15.2% | 17.7% | 17.5% |
| $150,000 to $199,999 | 6.4% | 11.3% | 9.6% |
| $200,000 or more | 5.6% | 19.2% | 13.4% |
Source: U.S. Census ACS 5-year estimates (2024)


