New Haven SnackAbility
Overall SnackAbility
Crime in New Haven summary. We use data from the FBI to determine the crime rates in New Haven. Key points include:
There were 5,657 total crimes in New Haven in the last reporting year.
The overall crime rate per 100,000 people in New Haven is 4,121.9 / 100k people.
The violent crime rate per 100,000 people in New Haven is 534.8 / 100k people.
The property crime rate per 100,000 people in New Haven is 3,587.1 / 100k people.
Overall, crime in New Haven is 94.50% above the national average.
Total Crimes
Above National Average
Crime In New Haven Comparison Table
| Statistic | Count Raw |
New Haven / 100k People |
Connecticut / 100k People |
National / 100k People |
|---|---|---|---|---|
| Total Crimes Per 100K | 5,657 | 4,121.9 | 1,502.1 | 2,119.2 |
| Violent Crime | 734 | 534.8 | 136.0 | 359.0 |
| Murder | 15 | 10.9 | 2.4 | 5.0 |
| Robbery | 248 | 180.7 | 38.1 | 61.0 |
| Aggravated Assault | 427 | 311.1 | 77.5 | 256.0 |
| Property Crime | 4,923 | 3,587.1 | 1,366.1 | 1,760.0 |
| Burglary | 518 | 377.4 | 117.3 | 229.0 |
| Larceny | 3,297 | 2,402.3 | 1,013.7 | 1,272.0 |
| Car Theft | 1,108 | 807.3 | 235.0 | 259.0 |
Source: FBI Uniform Crime Reporting (2024)
Cost of living in New Haven summary. We use data on the cost of living to determine how expensive it is to live in New Haven. Real estate prices drive most of the variance in cost of living around Connecticut. Key points include:
The cost of living in New Haven is 114 with 100 being average.
The cost of living in New Haven is 1.1x higher than the national average.
The median home value in New Haven is $326,440.
The median income in New Haven is $56,851.
New Haven's Overall Cost Of Living
Higher Than The National Average
Cost Of Living In New Haven Comparison Table
| Living Expense | New Haven | Connecticut | National Average |
|---|---|---|---|
| Overall | 114 | 116 | 100 |
| Services | 103 | 107 | 100 |
| Groceries | 114 | 111 | 100 |
| Health | 119 | 137 | 100 |
| Housing | 111 | 108 | 100 |
| Transportation | 110 | 110 | 100 |
| Utilities | 114 | 111 | 100 |
Source: Cost of living index, normalized to US average = 100
New Haven, CT Weather
The average high in New Haven is 60.5° and the average low is 41.1°.
There are 77.6 days of precipitation each year.
Expect an average of 49.9 inches of precipitation each year with 34.0 inches of snow.
| Stat | New Haven |
|---|---|
| Average Annual High | 60.5 |
| Average Annual Low | 41.1 |
| Annual Precipitation Days | 77.6 |
| Average Annual Precipitation | 49.9 |
| Average Annual Snowfall | 34.0 |
Average High
Days of Rain
Source: NOAA climate normals (30-year)
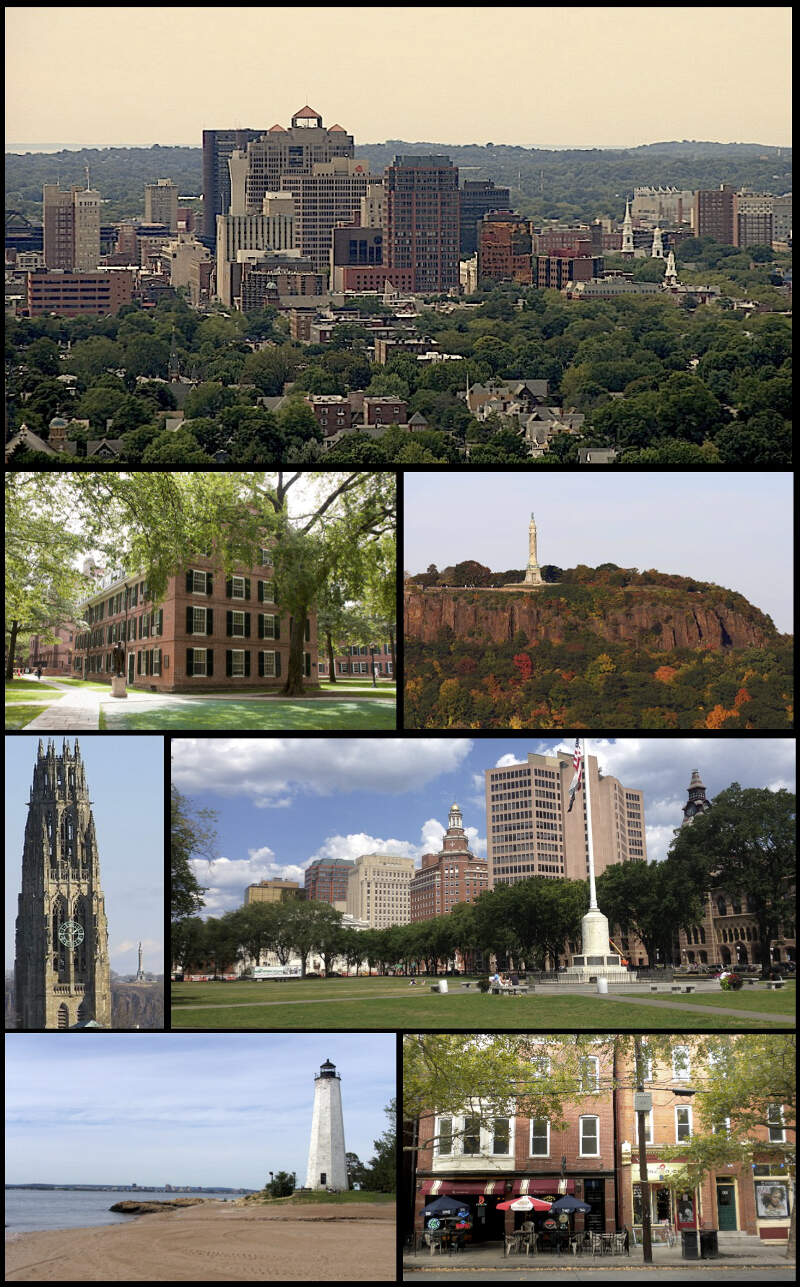
New Haven, CT Photos


6 Reviews & Comments About New Haven

Let's not lie, New Haven was good back in the 2000's but now the gov is in debt and it's so pricy. It's going down. Thankfully I live in the near west vile/ Woodbridge and that's the best neighborhood I've seen
I live in New Haven, and its quiet, and I live a couple minutes away!! Also, I go to AAMS, and we're ranked #1 in the state for middle schools so stfu with yo fake facts.
New Haven is Not all Crappy. There are Outskirts like near Southern & near Amity.
Also by Whitney Ave. Nice Houses.
I live in Hamden. 5 minutes away.
I Love It. New Haven & Hamden.
Connecticut S***S! I live in New Haven. New Haven is very bad.
There is something for everyone to do. There are many colleges in the area to visit
There are so many places to eat at. New Haven is known for its pizza!
Beautiful architecture, very cozy college atmosphere, lots of variety of stores and sites
Large contrast between gentrified and ungentrified areas
Rankings & Articles For New Haven


Locations Around New Haven
Map Of New Haven, CT
Best Places Around New Haven
Orange, CT
Population 14,315
North Haven, CT
Population 24,336
Milford, CT
Population 51,023
Shelton, CT
Population 41,889
East Haven, CT
Population 27,806
Wallingford Center, CT
Population 18,208
Ansonia, CT
Population 19,033
New Haven Demographics And Statistics
Population over time in New Haven
The current population in New Haven is 134,349. The population has increased 4.2% from 2010.
| Year | Population | % Change |
|---|---|---|
| 2024 | 134,349 | 1.1% |
| 2023 | 132,893 | -2.1% |
| 2022 | 135,736 | 1.4% |
| 2021 | 133,874 | 2.7% |
| 2020 | 130,381 | 0.0% |
| 2019 | 130,331 | -0.2% |
| 2018 | 130,529 | -0.3% |
| 2017 | 130,884 | 0.4% |
| 2016 | 130,405 | -0.2% |
| 2015 | 130,612 | 0.0% |
| 2014 | 130,553 | 0.2% |
| 2013 | 130,338 | 0.3% |
| 2012 | 129,898 | 0.5% |
| 2011 | 129,213 | 0.3% |
| 2010 | 128,885 | - |
Race / Ethnicity in New Haven
See the full breakdown
New Haven is:
30.0% White with 40,362 White residents.
27.6% African American with 37,144 African American residents.
0.2% American Indian with 280 American Indian residents.
5.2% Asian with 7,032 Asian residents.
0.0% Hawaiian with 0 Hawaiian residents.
1.8% Other with 2,369 Other residents.
4.1% Two Or More with 5,482 Two Or More residents.
31.0% Hispanic with 41,680 Hispanic residents.
| Race | New Haven | CT | USA |
|---|---|---|---|
| White | 30.0% | 61.9% | 57.4% |
| African American | 27.6% | 9.8% | 11.9% |
| American Indian | 0.2% | 0.1% | 0.5% |
| Asian | 5.2% | 4.7% | 5.9% |
| Hawaiian | 0.0% | 0.0% | 0.2% |
| Other | 1.8% | 0.9% | 0.6% |
| Two Or More | 4.1% | 4.3% | 4.3% |
| Hispanic | 31.0% | 18.3% | 19.3% |
Gender in New Haven
See the full breakdown
New Haven is 52.2% female with 70,175 female residents.
New Haven is 47.8% male with 64,174 male residents.
| Gender | New Haven | CT | USA |
|---|---|---|---|
| Female | 52.2% | 50.9% | 50.5% |
| Male | 47.8% | 49.1% | 49.5% |
Highest level of educational attainment in New Haven for adults over 25
See the full breakdown
6.0% of adults in New Haven completed < 9th grade.
7.0% of adults in New Haven completed 9-12th grade.
30.0% of adults in New Haven completed high school / ged.
13.0% of adults in New Haven completed some college.
5.0% of adults in New Haven completed associate's degree.
18.0% of adults in New Haven completed bachelor's degree.
12.0% of adults in New Haven completed master's degree.
4.0% of adults in New Haven completed professional degree.
5.0% of adults in New Haven completed doctorate degree.
| Education | New Haven | CT | USA |
|---|---|---|---|
| < 9th Grade | 6.0% | 5.0% | 4.0% |
| 9-12th Grade | 7.0% | 4.0% | 6.0% |
| High School / GED | 30.0% | 25.0% | 26.0% |
| Some College | 13.0% | 16.0% | 19.0% |
| Associate's Degree | 5.0% | 8.0% | 9.0% |
| Bachelor's Degree | 18.0% | 23.0% | 22.0% |
| Master's Degree | 12.0% | 14.0% | 10.0% |
| Professional Degree | 4.0% | 3.0% | 2.0% |
| Doctorate Degree | 5.0% | 2.0% | 2.0% |
Household Income For New Haven, Connecticut
See the full breakdown
10.0% of households in New Haven earn Less than $10,000.
6.3% of households in New Haven earn $10,000 to $14,999.
8.2% of households in New Haven earn $15,000 to $24,999.
8.5% of households in New Haven earn $25,000 to $34,999.
13.0% of households in New Haven earn $35,000 to $49,999.
14.8% of households in New Haven earn $50,000 to $74,999.
11.2% of households in New Haven earn $75,000 to $99,999.
12.3% of households in New Haven earn $100,000 to $149,999.
6.8% of households in New Haven earn $150,000 to $199,999.
8.7% of households in New Haven earn $200,000 or more.
| Income | New Haven | CT | USA |
|---|---|---|---|
| Less than $10,000 | 10.0% | 4.5% | 5.0% |
| $10,000 to $14,999 | 6.3% | 3.1% | 3.4% |
| $15,000 to $24,999 | 8.2% | 5.3% | 6.3% |
| $25,000 to $34,999 | 8.5% | 5.3% | 6.6% |
| $35,000 to $49,999 | 13.0% | 8.4% | 10.1% |
| $50,000 to $74,999 | 14.8% | 13.3% | 15.5% |
| $75,000 to $99,999 | 11.2% | 11.9% | 12.6% |
| $100,000 to $149,999 | 12.3% | 17.7% | 17.5% |
| $150,000 to $199,999 | 6.8% | 11.3% | 9.6% |
| $200,000 or more | 8.7% | 19.2% | 13.4% |
Source: U.S. Census ACS 5-year estimates (2024)


