Norwalk, CT
Demographics And Statistics
Living In Norwalk, Connecticut Summary
Life in Norwalk research summary. HomeSnacks has been using Saturday Night Science to research the quality of life in Norwalk over the past nine years using Census, FBI, Zillow, and other primary data sources. Based on the most recently available data, we found the following about life in Norwalk:
The population in Norwalk is 91,375.
The median home value in Norwalk is $642,542.
The median income in Norwalk is $105,301.
The cost of living in Norwalk is 145 which is 1.4x higher than the national average.
The median rent in Norwalk is $2,010.
The unemployment rate in Norwalk is 5.8%.
The poverty rate in Norwalk is 10.1%.
The average high in Norwalk is 60.9° and the average low is 42.3°.
Norwalk SnackAbility
Overall SnackAbility
Norwalk, CT Crime Report
Crime in Norwalk summary. We use data from the FBI to determine the crime rates in Norwalk. Key points include:
There were 1,478 total crimes in Norwalk in the last reporting year.
The overall crime rate per 100,000 people in Norwalk is 1,589.5 / 100k people.
The violent crime rate per 100,000 people in Norwalk is 85.0 / 100k people.
The property crime rate per 100,000 people in Norwalk is 1,504.5 / 100k people.
Overall, crime in Norwalk is -25.00% below the national average.
Total Crimes
Below National Average
Crime In Norwalk Comparison Table
| Statistic | Count Raw |
Norwalk / 100k People |
Connecticut / 100k People |
National / 100k People |
|---|---|---|---|---|
| Total Crimes Per 100K | 1,478 | 1,589.5 | 1,502.1 | 2,119.2 |
| Violent Crime | 79 | 85.0 | 136.0 | 359.0 |
| Murder | 0 | 0.0 | 2.4 | 5.0 |
| Robbery | 15 | 16.1 | 38.1 | 61.0 |
| Aggravated Assault | 49 | 52.7 | 77.5 | 256.0 |
| Property Crime | 1,399 | 1,504.5 | 1,366.1 | 1,760.0 |
| Burglary | 227 | 244.1 | 117.3 | 229.0 |
| Larceny | 1,021 | 1,098.0 | 1,013.7 | 1,272.0 |
| Car Theft | 151 | 162.4 | 235.0 | 259.0 |
Norwalk, CT Cost Of Living
Cost of living in Norwalk summary. We use data on the cost of living to determine how expensive it is to live in Norwalk. Real estate prices drive most of the variance in cost of living around Connecticut. Key points include:
The cost of living in Norwalk is 145 with 100 being average.
The cost of living in Norwalk is 1.4x higher than the national average.
The median home value in Norwalk is $642,542.
The median income in Norwalk is $105,301.
Norwalk's Overall Cost Of Living
Higher Than The National Average
Cost Of Living In Norwalk Comparison Table
| Living Expense | Norwalk | Connecticut | National Average | |
|---|---|---|---|---|
| Overall | 145 | 119 | 100 | |
| Services | 115 | 109 | 100 | |
| Groceries | 106 | 100 | 100 | |
| Health | 111 | 110 | 100 | |
| Housing | 221 | 137 | 100 | |
| Transportation | 104 | 101 | 100 | |
| Utilities | 133 | 131 | 100 | |
Norwalk, CT Weather
The average high in Norwalk is 60.9° and the average low is 42.3°.
There are 79.7 days of precipitation each year.
Expect an average of 49.1 inches of precipitation each year with 34.7 inches of snow.
| Stat | Norwalk |
|---|---|
| Average Annual High | 60.9 |
| Average Annual Low | 42.3 |
| Annual Precipitation Days | 79.7 |
| Average Annual Precipitation | 49.1 |
| Average Annual Snowfall | 34.7 |
Average High
Days of Rain
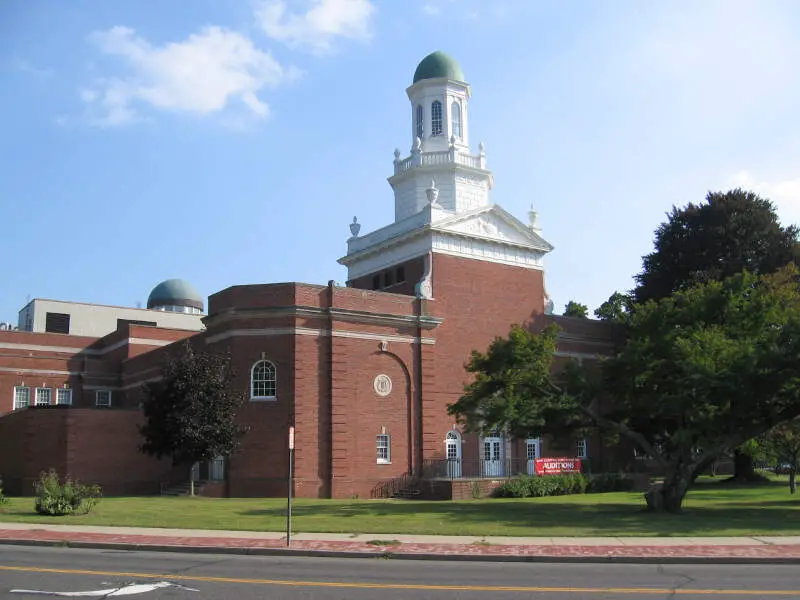
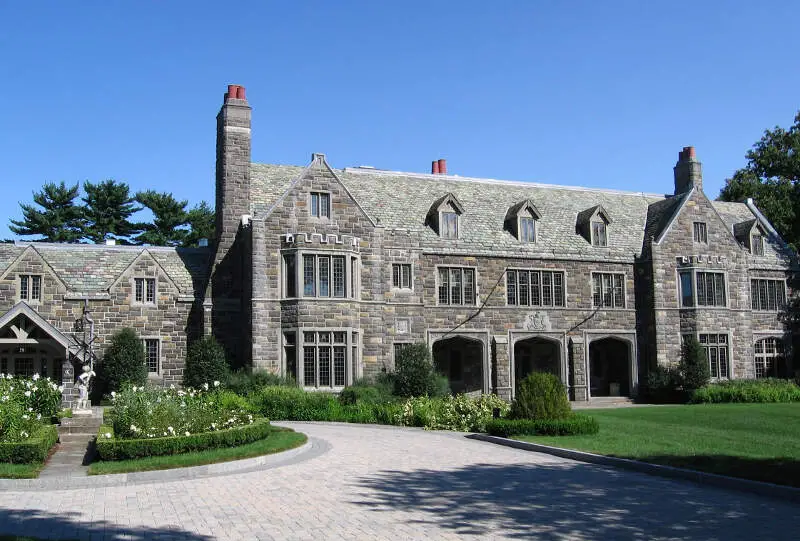
Norwalk, CT Photos


Rankings for Norwalk in Connecticut


Locations Around Norwalk
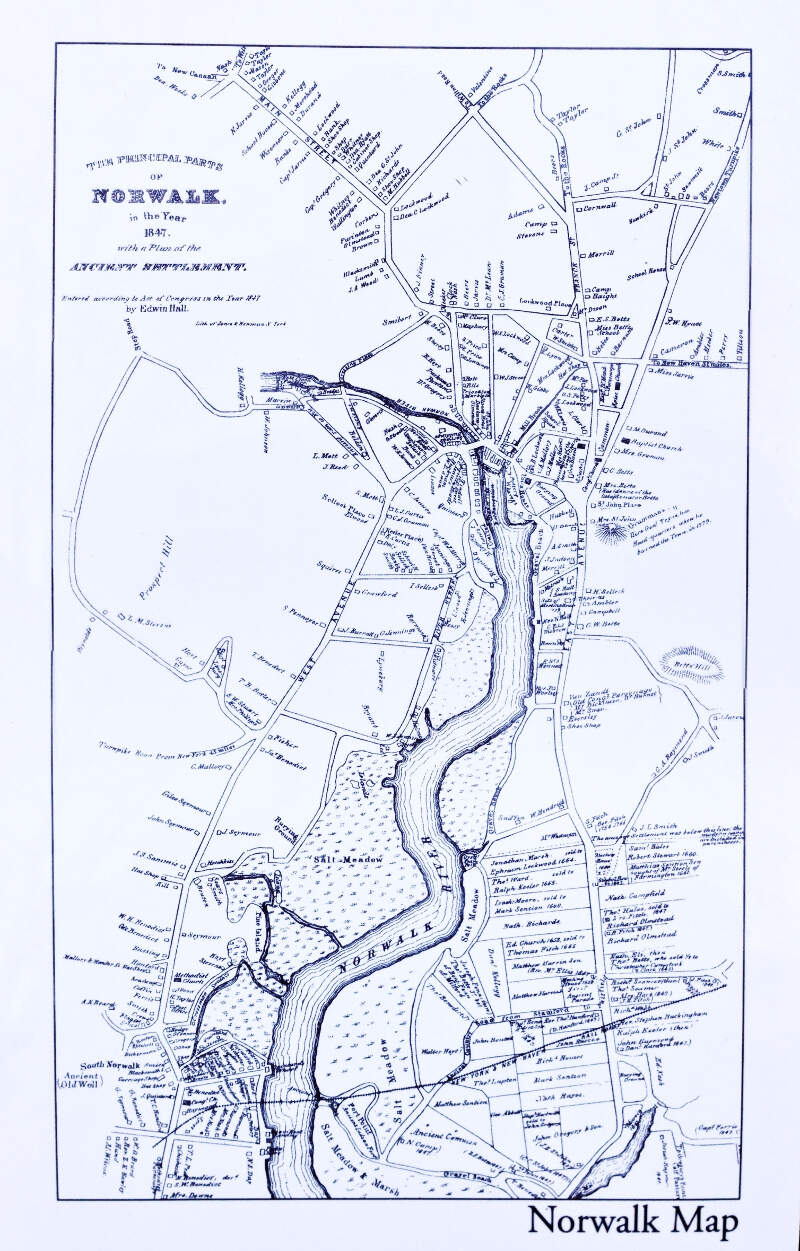
Map Of Norwalk, CT
Best Places Around Norwalk
Syosset, NY
Population 18,274
Pleasantville, NY
Population 7,395
Mamaroneck, NY
Population 19,840
Huntington, NY
Population 20,117
Commack, NY
Population 36,353
Stony Brook, NY
Population 12,827
Bayville, NY
Population 6,744
Northport, NY
Population 7,320
Rye Brook, NY
Population 9,884
Smithtown, NY
Population 24,940
Norwalk Demographics And Statistics
Population over time in Norwalk
The current population in Norwalk is 91,375. The population has increased 8.0% from 2010.
| Year | Population | % Change |
|---|---|---|
| 2023 | 91,375 | 0.4% |
| 2022 | 91,050 | 0.3% |
| 2021 | 90,821 | 2.3% |
| 2020 | 88,755 | 0.2% |
| 2019 | 88,599 | 0.2% |
| 2018 | 88,436 | -0.1% |
| 2017 | 88,537 | 0.7% |
| 2016 | 87,930 | 0.3% |
| 2015 | 87,701 | 0.6% |
| 2014 | 87,214 | 0.8% |
| 2013 | 86,499 | 0.8% |
| 2012 | 85,853 | 0.8% |
| 2011 | 85,145 | 0.6% |
| 2010 | 84,611 | - |
Race / Ethnicity in Norwalk
Norwalk is:
42.7% White with 39,052 White residents.
17.5% African American with 16,026 African American residents.
0.0% American Indian with 34 American Indian residents.
4.7% Asian with 4,258 Asian residents.
0.0% Hawaiian with 0 Hawaiian residents.
0.4% Other with 406 Other residents.
3.2% Two Or More with 2,919 Two Or More residents.
31.4% Hispanic with 28,680 Hispanic residents.
| Race | Norwalk | CT | USA |
|---|---|---|---|
| White | 42.7% | 63.0% | 58.2% |
| African American | 17.5% | 9.9% | 12.0% |
| American Indian | 0.0% | 0.1% | 0.5% |
| Asian | 4.7% | 4.7% | 5.7% |
| Hawaiian | 0.0% | 0.0% | 0.2% |
| Other | 0.4% | 0.7% | 0.5% |
| Two Or More | 3.2% | 3.8% | 3.9% |
| Hispanic | 31.4% | 17.8% | 19.0% |
Gender in Norwalk
Norwalk is 50.3% female with 45,989 female residents.
Norwalk is 49.7% male with 45,386 male residents.
| Gender | Norwalk | CT | USA |
|---|---|---|---|
| Female | 50.3% | 50.9% | 50.5% |
| Male | 49.7% | 49.1% | 49.5% |
Highest level of educational attainment in Norwalk for adults over 25
7.0% of adults in Norwalk completed < 9th grade.
4.0% of adults in Norwalk completed 9-12th grade.
22.0% of adults in Norwalk completed high school / ged.
15.0% of adults in Norwalk completed some college.
7.0% of adults in Norwalk completed associate's degree.
26.0% of adults in Norwalk completed bachelor's degree.
14.0% of adults in Norwalk completed master's degree.
3.0% of adults in Norwalk completed professional degree.
2.0% of adults in Norwalk completed doctorate degree.
| Education | Norwalk | CT | USA |
|---|---|---|---|
| < 9th Grade | 7.0% | 3.0% | 5.0% |
| 9-12th Grade | 4.0% | 5.0% | 6.0% |
| High School / GED | 22.0% | 26.0% | 26.0% |
| Some College | 15.0% | 16.0% | 19.0% |
| Associate's Degree | 7.0% | 8.0% | 9.0% |
| Bachelor's Degree | 26.0% | 23.0% | 21.0% |
| Master's Degree | 14.0% | 14.0% | 10.0% |
| Professional Degree | 3.0% | 3.0% | 2.0% |
| Doctorate Degree | 2.0% | 2.0% | 2.0% |
Household Income For Norwalk, Connecticut
3.7% of households in Norwalk earn Less than $10,000.
3.3% of households in Norwalk earn $10,000 to $14,999.
4.7% of households in Norwalk earn $15,000 to $24,999.
4.8% of households in Norwalk earn $25,000 to $34,999.
7.7% of households in Norwalk earn $35,000 to $49,999.
12.6% of households in Norwalk earn $50,000 to $74,999.
11.0% of households in Norwalk earn $75,000 to $99,999.
18.5% of households in Norwalk earn $100,000 to $149,999.
12.0% of households in Norwalk earn $150,000 to $199,999.
21.7% of households in Norwalk earn $200,000 or more.
| Income | Norwalk | CT | USA |
|---|---|---|---|
| Less than $10,000 | 3.7% | 4.4% | 4.9% |
| $10,000 to $14,999 | 3.3% | 3.2% | 3.6% |
| $15,000 to $24,999 | 4.7% | 5.6% | 6.6% |
| $25,000 to $34,999 | 4.8% | 5.6% | 6.8% |
| $35,000 to $49,999 | 7.7% | 8.6% | 10.4% |
| $50,000 to $74,999 | 12.6% | 13.4% | 15.7% |
| $75,000 to $99,999 | 11.0% | 12.0% | 12.7% |
| $100,000 to $149,999 | 18.5% | 17.8% | 17.4% |
| $150,000 to $199,999 | 12.0% | 11.2% | 9.3% |
| $200,000 or more | 21.7% | 18.2% | 12.6% |


