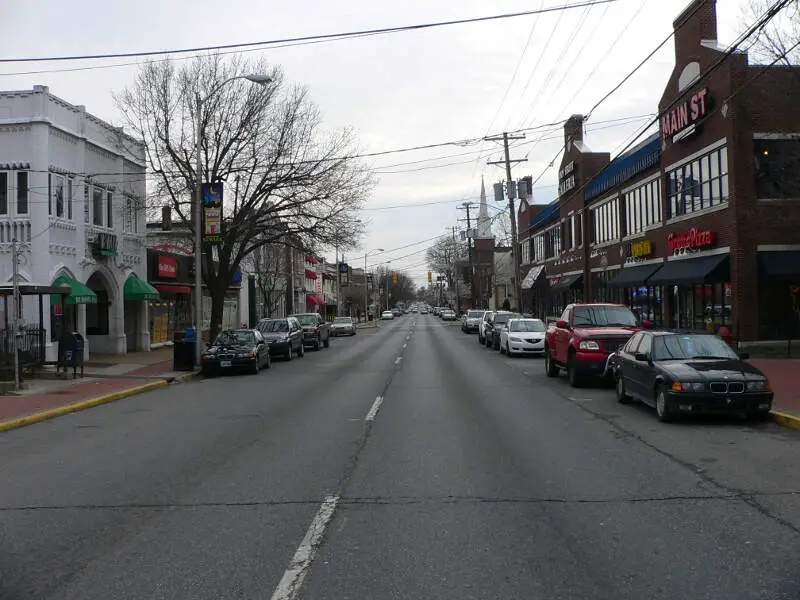
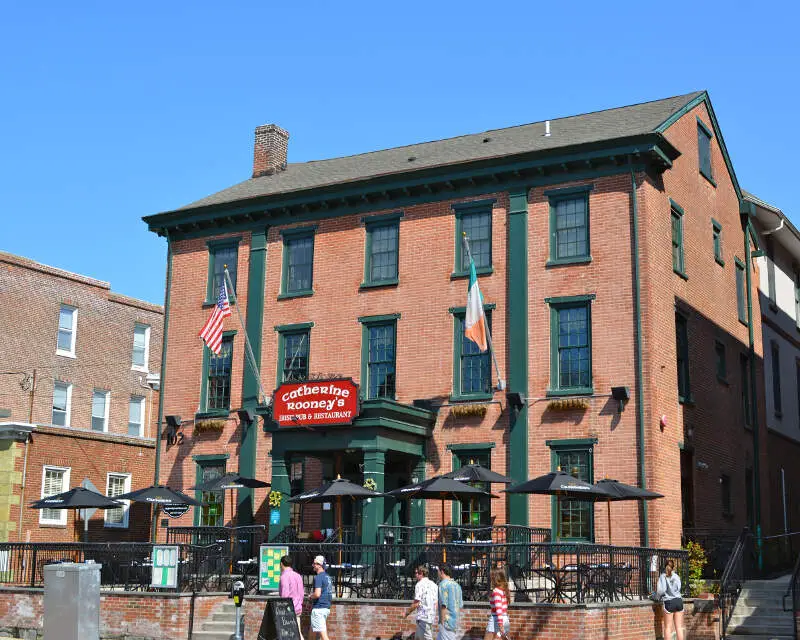
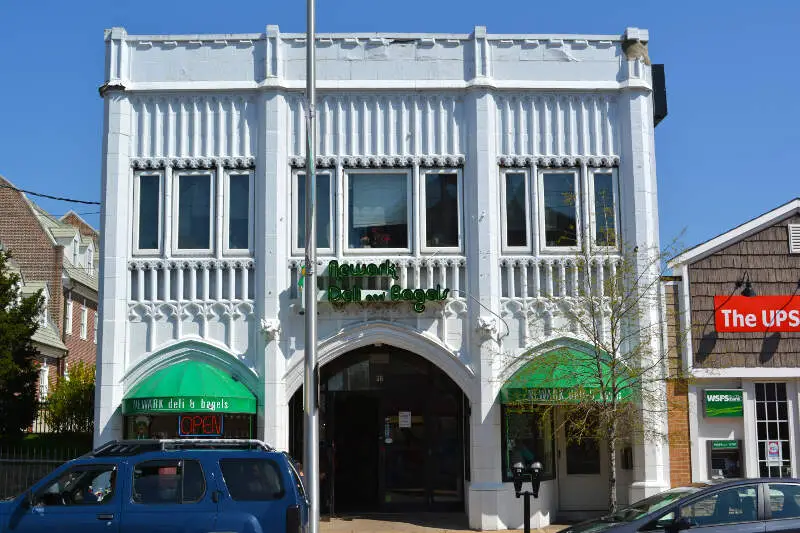
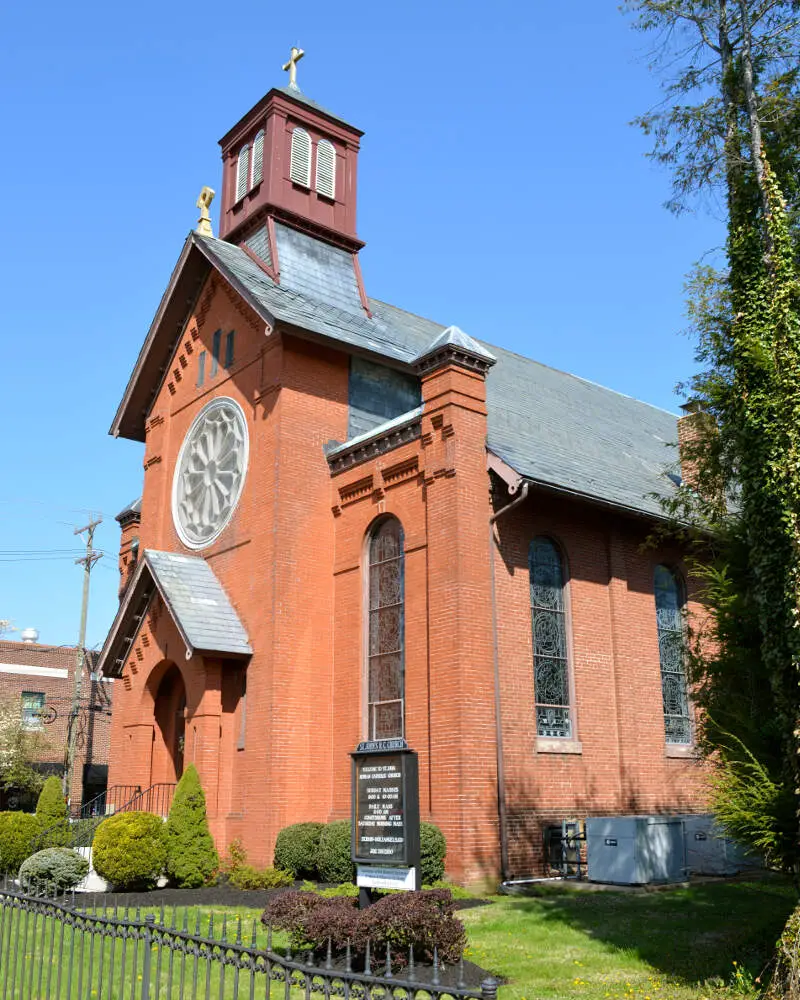
Newark, DE
Demographics And Statistics
Living In Newark, Delaware Summary
Life in Newark research summary. HomeSnacks has been using Saturday Night Science to research the quality of life in Newark over the past nine years using Census, FBI, Zillow, and other primary data sources. Based on the most recently available data, we found the following about life in Newark:
The population in Newark is 30,309.
The median home value in Newark is $357,796.
The median income in Newark is $71,373.
The cost of living in Newark is 118 which is 1.2x higher than the national average.
The median rent in Newark is $1,611.
The unemployment rate in Newark is 6.7%.
The poverty rate in Newark is 27.1%.
The average high in Newark is 64.4° and the average low is 44.4°.
Newark SnackAbility
Overall SnackAbility
Newark, DE Crime Report
Crime in Newark summary. We use data from the FBI to determine the crime rates in Newark. Key points include:
There were 693 total crimes in Newark in the last reporting year.
The overall crime rate per 100,000 people in Newark is 2,307.7 / 100k people.
The violent crime rate per 100,000 people in Newark is 309.7 / 100k people.
The property crime rate per 100,000 people in Newark is 1,998.0 / 100k people.
Overall, crime in Newark is 8.89% above the national average.
Total Crimes
Above National Average
Crime In Newark Comparison Table
| Statistic | Count Raw |
Newark / 100k People |
Delaware / 100k People |
National / 100k People |
|---|---|---|---|---|
| Total Crimes Per 100K | 693 | 2,307.7 | 2,106.5 | 2,119.2 |
| Violent Crime | 93 | 309.7 | 360.8 | 359.0 |
| Murder | 1 | 3.3 | 5.7 | 5.0 |
| Robbery | 7 | 23.3 | 47.0 | 61.0 |
| Aggravated Assault | 78 | 259.7 | 292.4 | 256.0 |
| Property Crime | 600 | 1,998.0 | 1,745.8 | 1,760.0 |
| Burglary | 54 | 179.8 | 175.1 | 229.0 |
| Larceny | 484 | 1,611.7 | 1,361.9 | 1,272.0 |
| Car Theft | 62 | 206.5 | 208.8 | 259.0 |
Newark, DE Cost Of Living
Cost of living in Newark summary. We use data on the cost of living to determine how expensive it is to live in Newark. Real estate prices drive most of the variance in cost of living around Delaware. Key points include:
The cost of living in Newark is 118 with 100 being average.
The cost of living in Newark is 1.2x higher than the national average.
The median home value in Newark is $357,796.
The median income in Newark is $71,373.
Newark's Overall Cost Of Living
Higher Than The National Average
Cost Of Living In Newark Comparison Table
| Living Expense | Newark | Delaware | National Average | |
|---|---|---|---|---|
| Overall | 118 | 106 | 100 | |
| Services | 108 | 103 | 100 | |
| Groceries | 107 | 103 | 100 | |
| Health | 106 | 103 | 100 | |
| Housing | 146 | 123 | 100 | |
| Transportation | 110 | 102 | 100 | |
| Utilities | 94 | 100 | 100 | |
Newark, DE Weather
The average high in Newark is 64.4° and the average low is 44.4°.
There are 74.5 days of precipitation each year.
Expect an average of 45.4 inches of precipitation each year with 9.5 inches of snow.
| Stat | Newark |
|---|---|
| Average Annual High | 64.4 |
| Average Annual Low | 44.4 |
| Annual Precipitation Days | 74.5 |
| Average Annual Precipitation | 45.4 |
| Average Annual Snowfall | 9.5 |
Average High
Days of Rain
Newark, DE Photos
Newark Articles


Rankings for Newark in Delaware

Locations Around Newark
Map Of Newark, DE
Best Places Around Newark
Kennett Square, PA
Population 6,096
Pennsville, NJ
Population 12,238
Oxford, PA
Population 5,763
Carneys Point, NJ
Population 7,945
Pike Creek, DE
Population 7,185
Hockessin, DE
Population 13,608
North Star, DE
Population 8,178
Glasgow, DE
Population 16,095
Newark Demographics And Statistics
Population over time in Newark
The current population in Newark is 30,309. The population has decreased -2.6% from 2010.
| Year | Population | % Change |
|---|---|---|
| 2023 | 30,309 | -1.1% |
| 2022 | 30,655 | -2.4% |
| 2021 | 31,393 | -7.2% |
| 2020 | 33,822 | 1.1% |
| 2019 | 33,448 | 0.3% |
| 2018 | 33,352 | 0.3% |
| 2017 | 33,243 | 0.9% |
| 2016 | 32,941 | 0.6% |
| 2015 | 32,740 | 1.4% |
| 2014 | 32,278 | 1.0% |
| 2013 | 31,953 | 0.9% |
| 2012 | 31,655 | 1.2% |
| 2011 | 31,293 | 0.6% |
| 2010 | 31,110 | - |
Race / Ethnicity in Newark
Newark is:
65.9% White with 19,963 White residents.
10.7% African American with 3,258 African American residents.
0.1% American Indian with 33 American Indian residents.
8.0% Asian with 2,426 Asian residents.
0.0% Hawaiian with 0 Hawaiian residents.
0.3% Other with 93 Other residents.
5.0% Two Or More with 1,502 Two Or More residents.
10.0% Hispanic with 3,034 Hispanic residents.
| Race | Newark | DE | USA |
|---|---|---|---|
| White | 65.9% | 59.0% | 58.2% |
| African American | 10.7% | 21.4% | 12.0% |
| American Indian | 0.1% | 0.1% | 0.5% |
| Asian | 8.0% | 4.1% | 5.7% |
| Hawaiian | 0.0% | 0.0% | 0.2% |
| Other | 0.3% | 0.5% | 0.5% |
| Two Or More | 5.0% | 4.1% | 3.9% |
| Hispanic | 10.0% | 10.7% | 19.0% |
Gender in Newark
Newark is 52.3% female with 15,846 female residents.
Newark is 47.7% male with 14,463 male residents.
| Gender | Newark | DE | USA |
|---|---|---|---|
| Female | 52.3% | 51.5% | 50.5% |
| Male | 47.7% | 48.5% | 49.5% |
Highest level of educational attainment in Newark for adults over 25
2.0% of adults in Newark completed < 9th grade.
2.0% of adults in Newark completed 9-12th grade.
16.0% of adults in Newark completed high school / ged.
16.0% of adults in Newark completed some college.
7.0% of adults in Newark completed associate's degree.
30.0% of adults in Newark completed bachelor's degree.
16.0% of adults in Newark completed master's degree.
1.0% of adults in Newark completed professional degree.
10.0% of adults in Newark completed doctorate degree.
| Education | Newark | DE | USA |
|---|---|---|---|
| < 9th Grade | 2.0% | 4.0% | 5.0% |
| 9-12th Grade | 2.0% | 5.0% | 6.0% |
| High School / GED | 16.0% | 29.0% | 26.0% |
| Some College | 16.0% | 19.0% | 19.0% |
| Associate's Degree | 7.0% | 8.0% | 9.0% |
| Bachelor's Degree | 30.0% | 20.0% | 21.0% |
| Master's Degree | 16.0% | 11.0% | 10.0% |
| Professional Degree | 1.0% | 2.0% | 2.0% |
| Doctorate Degree | 10.0% | 2.0% | 2.0% |
Household Income For Newark, Delaware
10.2% of households in Newark earn Less than $10,000.
3.8% of households in Newark earn $10,000 to $14,999.
7.0% of households in Newark earn $15,000 to $24,999.
8.3% of households in Newark earn $25,000 to $34,999.
10.2% of households in Newark earn $35,000 to $49,999.
12.3% of households in Newark earn $50,000 to $74,999.
10.9% of households in Newark earn $75,000 to $99,999.
16.4% of households in Newark earn $100,000 to $149,999.
9.1% of households in Newark earn $150,000 to $199,999.
11.6% of households in Newark earn $200,000 or more.
| Income | Newark | DE | USA |
|---|---|---|---|
| Less than $10,000 | 10.2% | 4.0% | 4.9% |
| $10,000 to $14,999 | 3.8% | 2.8% | 3.6% |
| $15,000 to $24,999 | 7.0% | 5.6% | 6.6% |
| $25,000 to $34,999 | 8.3% | 6.3% | 6.8% |
| $35,000 to $49,999 | 10.2% | 10.5% | 10.4% |
| $50,000 to $74,999 | 12.3% | 16.0% | 15.7% |
| $75,000 to $99,999 | 10.9% | 13.7% | 12.7% |
| $100,000 to $149,999 | 16.4% | 18.7% | 17.4% |
| $150,000 to $199,999 | 9.1% | 10.7% | 9.3% |
| $200,000 or more | 11.6% | 11.5% | 12.6% |


